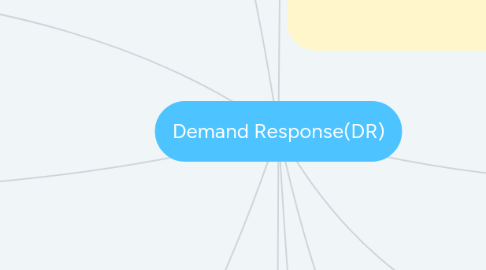
1. Overview
1.1. Peak Clipping
1.1.1. Reduce Peak Energy Consumption
1.2. Valley Filling
1.2.1. Rechargeable Batteries
1.3. Load Shifting
1.3.1. Shifting demand from ON-Peak to OFF-Peak
1.4. Smart Metering
1.4.1. Energy Management Systems
1.4.2. Advance Metering Infrastructure
1.5. Communication Infrastructure
1.5.1. Wired Network
1.5.1.1. Power Line Communications
1.5.1.2. Fiber Optics
1.5.1.3. Ethernet
1.5.1.4. Internet Domain
1.5.1.4.1. Home Area Network (HAN)
1.5.1.4.2. Industrial Area Network (IAN)
1.5.1.4.3. Business Area Network(BAN)
1.5.1.4.4. Field Area Network(FAN)
1.5.1.4.5. Neighborhood Area Network (NAN
1.5.1.4.6. Wide Area Network (WAN)
1.5.2. Wireless Network
1.5.2.1. ZigBee
1.5.2.2. Z-Wave
1.5.2.3. Wi-Fi
1.5.2.4. Wi-Max
1.5.2.5. Cognitive Radio
1.6. Standards & Protocols
1.6.1. NIST
1.6.2. IEEE
1.6.3. AS/NZS 4755.3.2
2. Classifications of DR
2.1. Types of DR Programs
2.1.1. Incentive-based DR
2.1.1.1. Direct Load Control (DLC)
2.1.1.1.1. Small Consumers(e.g residential)
2.1.1.2. Curtailable Load
2.1.1.2.1. Medium & Large consumers (e.g Commercial, Industrial)
2.1.1.3. Demand Side bidding,capacity & ancillary service (DSBCAS)
2.1.2. Price-based DR
2.1.2.1. Time-of-use tariff
2.1.2.2. Critical Peak pricing
2.1.2.3. Real-time pricing
2.1.2.4. Inclining block rate
2.2. Use of Electricity
2.2.1. Industrial Customer
2.2.1.1. use of electricity up to 80%
2.2.2. Commercial & Non-residential
2.2.2.1. HVAC Systems
2.2.2.2. Variable Frequency drives
2.2.3. Residential customers
2.2.4. Electric Vehicles
2.2.5. Data centers
3. Benefits of Demand Response
3.1. Regional greenhouse gas emission control schemes
3.2. Wind & Solar capacity increase
3.3. Low cost for customers
4. Practical Implementations
4.1. North America
4.1.1. United States
4.1.2. Canada
4.1.3. Mexico
4.2. South America
4.2.1. Brazil
4.2.2. Colombia
4.2.3. Chile
4.3. United Kingdom
4.3.1. Belgium
4.3.2. France
4.3.3. Finland
4.3.4. Norway
4.3.5. Sweden
4.3.6. Germany
4.3.7. Netherland
4.4. Oceania
4.4.1. Australia
4.4.2. New Zealand
4.5. Asia
4.5.1. Singapore
4.5.2. Japan
4.5.3. South Korea
4.5.4. China

