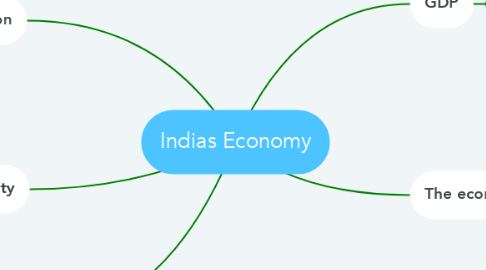
Indias Economy
by Marcus Nørgaard Bech

1. Inflation
1.1. 2012: 10%
1.2. 2013: 9,4%
1.3. 2014: 5,8%
1.4. 2015: 4,9%
1.5. 2016: 4,5%
1.6. 2017: 3,6%
1.7. 2018: 4,74%
2. Inequality
2.1. Growing income inequality Top 10% share in 2000: 39,9% Bottom 50& share in 2000: 20,5% Top 10% share in today: 56,6% Bottom 50& share in today: 14,7%
3. Salary
3.1. The minimum wage currently varies from Rs.4,500 to Rs.9,500 a month for unskilled workers in various states.
4. GDP
4.1. 1970: 63 billion USD
4.2. 1980: 189 billion USD
4.3. 1990: 326 billion USD
4.4. 2000: 475 billion USD
4.5. Now: 2597 billion USD
5. The economy
5.1. The economy of India is a developing mixed economy. It is the world's sixth-largest economy by nominal GDP and the third-largest by purchasing power parity (PPP). The country ranks 139th in per capita GDP (nominal) with $2,134 and 122nd in per capita GDP (PPP) with $7,783 as of 2018.
5.2. India’s labour market has more than 470 million workers and around 12 million are entering the labour force every year.


