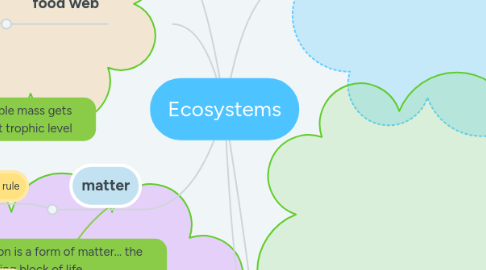
1. energy
1.1. 10% rule
2. carbon cycling
2.1. reservoirs
2.1.1. atmosphere and hydrosphere
2.1.2. biosphere
2.1.3. lithosphere (ground)
2.2. processes
2.2.1. photosynthesis
2.2.1.1. 6CO2 + ^ H2O + light --> C6H12O6 + 6O2
2.2.2. respiration
2.2.2.1. aerobic
2.2.2.1.1. glucose + oxygen --> water and carbon dioxide
2.2.2.1.2. opposite reaction to photosynthesis
2.2.2.1.3. produces 36 ATP per glucose
2.2.2.2. anaerobic
2.2.2.2.1. occurs without oxygen
2.2.2.2.2. only produces 2 ATP per glucose
3. matter
3.1. 10% rule
4. food web
4.1. trophic levels
4.1.1. heterotroph
4.1.1.1. carnivore
4.1.1.1.1. tertiary consumer
4.1.1.1.2. secondary consumer
4.1.1.2. herbivore
4.1.1.2.1. primary consumer
4.1.2. autotroph
4.1.2.1. producer
4.1.2.1.1. plants, algae...
5. animal behavior
5.1. group
5.1.1. herding
5.1.1.1. for defense, finding food, finding mates
5.1.2. grooming
5.1.2.1. social bonds; reduce disease
5.1.3. fight predator
5.1.3.1. increases survival of herd
5.2. individual
5.2.1. hide or head to water after born
5.2.1.1. safety from predators
5.3. innate
5.3.1. migration
5.3.1.1. find food in season
5.4. learned
5.4.1. hunting strategies
6. Carrying Capacity
6.1. biotic factors
6.1.1. predator-prey relationship
6.1.2. population density
6.1.2.1. higher density = more competition but easier to find mates
6.1.3. predator-prey relationship
6.1.3.1. predator population shadows prey population - same pattern but later
6.2. abiotic factors
6.2.1. climate
6.2.2. disasters
6.2.3. water supply
6.2.4. ecosystem size
6.2.4.1. more room means more resources, less competition...
6.3. population graphs
6.3.1. carrying capacity = maximum stable population
6.3.1.1. population varies above and below
6.3.2. J-curve
6.3.2.1. no predator = uncontrolled growth
6.3.3. S curve
6.3.3.1. growth slows approaching carrying capacity

