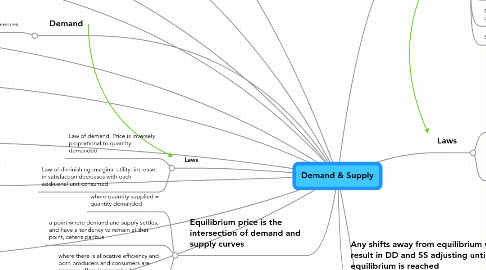
Demand & Supply
by Ashram Ramgarib
1. Demand factors
2. Availability of related goods
3. Expectation of future price changes
4. Substitute goods are in competitive demand (Eab>0)
4.1. Changes in population and its structure
5. Complementary goods are in joint demand (Eab<0)
6. Changes in levels and distribution of income
7. Demand schedule is a table representing points on a demand curve
8. is the willingness, desire and ability to buy a good
9. Opportunity cost is what could've been bought in place of that good itself
10. Shifts are changes in demand, movements are changes in price resulting from quantity demanded
11. Demand
11.1. Changes in taste/preferences
12. Laws
12.1. Law of demand: Price is inversely proportional to quantity demanded
12.2. Law of diminishing marginal utility: increase in satisfaction decreases with each additional unit consumed
13. Equilibrium price is the intersection of demand and supply curves
13.1. where quantity supplied = quantity demanded
13.2. a point where demand and supply settles, and have a tendency to remain at that point, ceteris paribus
13.3. where there is allocative efficiency and both producers and consumers are happy, welfare is maximised
14. H2: Consumer and producer surplus
14.1. Consumer surplus: The difference between what consumers are willing and able to pay for a good and what they actually pay for it
14.2. Area below the demand curve to the price line
14.3. Producer surplus: the difference between the cost price of the good and the price they receive
14.4. Area below the price line and above the supply curve
15. Supply
15.1. Supply schedule is a table representative of the points of a SS curve
15.2. Is the desire to produce a certain good backed by willingness and ability to do so
15.3. A shift in the supply curve is a change in supply, but a movement along the curve is a change in quantity supplied resulting from a change in price of the good itself
15.4. Supply factors
15.5. Marginal cost of production
15.6. Changes in production of related goods
15.7. Natural disasters, unpredictable events
15.8. Speculation
16. Laws
16.1. Law of supply: Price is directly proportional to quantity supplied
16.2. Law of diminishing marginal returns: as output increases, marginal costs increases, as more workers means lees capital to work with, explaining the upward sloping SS curve
17. Any shifts away from equilibrium will result in DD and SS adjusting until a new equilibrium is reached
17.1. A shift in SS to the right will cause a surplus and put a downward pressure on price, ceteris paribus
17.2. A shift in DD to the right will cause a shortage and put upward pressure on prices, ceteris paribus
17.3. When there is shifting of both DD and SS in the same direction, the magnitude of the shift would determine the direction of pressure on prices

