1. Defining and measuring development
1.1. 'Economically developed ' (developed countries; advanced economies)
1.2. 'Economically developing' (developing countries; underdeveloped economies)
1.3. Development indicators
1.3.1. Economic Indicators: GDP/GNP, Per capita income, PPP, Unemployment and Underemployment, Capital formation and investment, inflation, Fiscal balance, Trade balance, Energy consumption, Percentage employed in agriculture.
1.3.1.1. Non- economic indicators: Housing, Educational opportunities, Social services (health, sport, recreation), Modernization of the public (civil) service., Levels of crime, Freedom of the press, Treatment of women, children, elderly and the marginalized, Pollution levels and environmental conservation, Civic consciousness and participation.
1.4. Field work skills can integrated and be used to represent data collected, in the form of charts, graphs and maps to measure the indicators of development. For instance: 1. Construct using the data provided a table to show Social and economic indicators for Named developing countries. 2.Using data in table 9.5 create a bar chart to illustrate the differences in per capita GDP. 3. Draw line graphs to show changes in access to safe drinking water in Urban and Rural areas of Honduras from 1970 - 2002
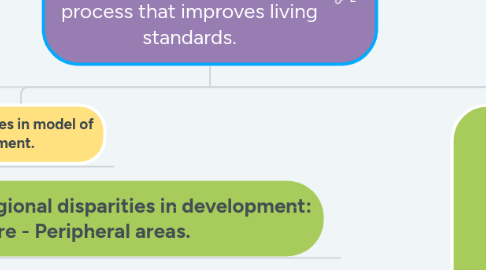
2. Disparities in model of development.
2.1. Regional disparities in development: Core - Peripheral areas.
2.1.1. Myrdal's cumulative causation:
2.2. Local disparities in development: Inner city suburbs and rich suburbs.
2.3. Friedman's core-periphery model:
2.3.1. Periphery: With increasing distance from the core ( distance -decay), standards of living and levels of development and wealth decrease.
2.3.2. Core: Capital city, Main port and industires, highly urbanized with most investment and services.
2.3.2.1. Pheriphery: Less urbanized with fewer industries, services and jobs.
2.4. Global disparities in development: The developed north vs the less developed south.
2.4.1. Rostow's model of development:
2.4.2. Dependency theory: Dependency theory or dependencia theory identifies a global system where economic benefits flow from a poor “periphery” to a wealthy “center” of countries. Dos Santos (1971) says: “Dependency favors some countries to the detriment of others … a situation in which the economy of a certain group of countries is conditioned by the development and expansion of another economy, to which their own is subjected.”
2.5. Map reading skills can be integrated to measure and gather data. For example, 1. Draw a map of the world to indicate world poverty distribution. Field work skills can also be used to apply appropriate investigative and practical technique. 2. Investigate the 2001 Millennium goals for poverty and hunger, education and gender equality and empowerment. 3. Collect data on development indicators for Britain.(Indicators should cover areas of income, poverty, health, education, environment and gender)4. Using data for estimated earned income for females in Table 10.3, identify one method which could be used to present this data graphically. 4. Test whether there is significant relationship between population growth and per capita GNP, using the formula for Spearman's rank Corelation coefficient.Physical geography can also be integrated to explain.(2010 6.C) Explain how two types of natural disasters and debt burden are constraints to development in the Caribbean.
3. Measures to over come disparities in development.
3.1. AID
3.1.1. Formal
3.1.1.1. Immediate crisis or long- term development projects
3.1.1.1.1. Larger amounts variable
3.1.1.1.2. Organisations (e.g. UN, IMF, WB, EU, IADB, CDB.
3.1.2. Voluntary
3.1.2.1. NGO's (e.g Oxfam, Save the children, Red Cross) and private donations.
3.1.2.1.1. Smaller amounts variable

