

1. Compounding
1.1. number of time periods increases the future value increases.
1.1.1. Co + Cf1 * (1+r)^1 + Cf2 * (1+r)^2 + --- + Cfn + (1+r)^n
1.2. Interest on interest
1.3. Increasing rate since there is more interest on interest
1.3.1. Co + Cf1/(1+r)^1 + Cf2/(1+r)^n --- + Cfn/(1+r)^n
1.4. Combing the project with borrowing or saving
2. Net Present Value NPV
2.1. You must respect the sign ( + / - )
2.2. the NPV allow us to evaluate an investment decision
2.3. cash flow at regular intervals forever it is call PERPETUITY
2.3.1. Cf/r
2.4. + = GOOD
2.4.1. Accepting or rejecting a project
2.5. - = BAD
2.5.1. Choosing among project
2.6. NPV= Pv(Benefits)-Pv(cost)
3. Financial appeceament
3.1. lever
3.2. little effort generates more money
3.3. a credit is very good when you are going to balance
4. Instrument
4.1. Instrument vs Potential theoretician
4.1.1. Profit bubble
4.1.2. Bad news
4.1.3. POSITIVE Rumors
4.1.4. About market reaction
5. Valuing Bonds and share
5.1. Bounds
5.1.1. Zero coupon
5.1.1.1. Cetes
5.1.2. Coupon Bonds
5.2. CPN = Coupon Rate X Face Value / Number of Coupon payments per year
5.3. |---c---c---c---c--c---|c+FV
5.4. Price = PV
5.4.1. Interest rate at which we discount bonds
5.5. Yield to Maturity
5.5.1. P = FV / (1 + YTMn)^n
5.6. Zero coupon
5.6.1. YTMn = (FV / P ) ^1/n - 1
5.7. Coupon Bond
5.7.1. P = CPN X 1/Y ( 1- 1 / (1 + Y)^N) + FV / (1+Y)^N
5.8. Yield to Maturity->Discount rate
5.9. Price of a coupon Bond
5.9.1. P = PV(Bond cash flows)
6. Capital Markets and CAPM (capital asset pricing model)
6.1. Small stocks the highest long-terms returns
6.1.1. largest fluctuations in price
6.2. Higher risk requires a higher return
6.3. T-Bills the lowest long-terms returns
6.3.1. lowest fluctuations in price
6.4. Expected return
6.4.1. E (R) = {r Pr X R
6.5. Varance
6.5.1. Var (R) = E [(R-E[R])^2]
6.6. Volality
6.6.1. Measure the total risk
6.6.1.1. SD ( R) = √ VAR(R)
6.7. Volatility measures total rick (systematic plus unsystematic)
6.8. Beta
6.8.1. measure the systematic risk
6.8.1.1. For every 1% change in the market, how much your security moves.
6.8.1.2. If the B is negative, you move to the inverse of the market
6.9. CAPM
6.9.1. Calculate the expected return for a risky security
6.9.2. Calculate the cost of particular project
7. Common Risk
7.1. Perfectly correlated
7.2. Affects all securities
8. Indepent Risk
8.1. Is uncorrelated
8.2. Affects a partiucular security
9. Diversification
9.1. The averaging out of indepent risks in a large portafolio
10. Rule 1 Only values at the same point in time can be compared or combined.
10.1. If it is in present value you don´t apply the formula
11. The timeline
11.1. A timeline is a linear representation of the timing of potencial cash flows.
11.2. 0---------1---------2
11.3. timeline help you visualize the financial problem.
11.4. Today is Date 0
11.5. X------>
11.6. ÷<------
11.7. NPV= PV(All project cash flows)
11.8. If the Cf is not in the same time you can't compare them.
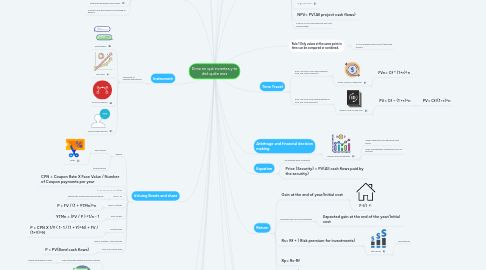
12. Time Travel
12.1. Rule 2 To move a cash flow forward in time, you must compund it.
12.1.1. Future Value of a cash flow.
12.1.1.1. FVn= Cf * (1+r)^n
12.2. Rule 3 To move a cash flow backward in time, you must discount it.
12.2.1. Present Value of cash flow.
12.2.1.1. PV= Cf ÷ (1 +r)^n
12.2.1.1.1. PV= Cf/(1÷r)^n
13. Rate
13.1. Depends the place you invest
14. Arbitrage and financial decision making
14.1. Valuing costs and benefits
14.1.1. Using market prices to determine cash values
14.1.2. When competetitive market prices are not available
15. Equation
15.1. No arbitrage price of security
15.2. Price (Security) = PV(All cash flows paid by the security)
16. Return
16.1. Gain at the end of year/Initial cost
16.1.1. F-I/I
16.2. Expected return of a risk investment
16.2.1. Expected gain at the end of the year/Initial cost
16.3. Rs= Rf + ( Risk premium for investments)
16.3.1. Extra profit
16.3.1.1. Risk premium
16.4. Rp= Rs-Rf
16.5. Rb = Rf+(Risk Premium for the bond
17. T-Bills
17.1. Tresure
17.2. Cetes
18. Using the payback rule
18.1. Payback period the lengt of time required to recover the cost of an investment.
18.1.1. Payback Period = Cost of project / Annual Cash flows
18.2. IRR
18.2.1. Internal rate of return
18.2.1.1. try and failure
18.2.1.2. Evalute and compare projects
18.2.1.3. Iterations
19. Investment grade
19.1. AAA & AA
19.1.1. High credit quality
19.2. A & BBB
19.2.1. Medium credit quaility
19.3. BB, B & CCC
19.3.1. Low credit quality (junk bonds)
19.4. Shares price
19.4.1. Div / Po
19.5. Po = Div1 + P1 / 1 +Re
19.6. Re = Div 1 + P1 / Po - 1
19.7. With different dividends
19.7.1. Po = Div1 / 1 + re + Div2 + p2 / (1 + Re)^2 + Divn / (1 + Re)^n
19.8. Dividend - Discount Model
19.8.1. Po = Div1 / Re - g
19.8.1.1. G
19.8.1.1.1. Growth rate
20. Market portofolio
20.1. An efficent consists of a weighted sum of each asset in the market
20.2. Market Risk premium
20.2.1. E [Rmkt] - Rf
20.3. CAPM
20.3.1. E(R)= rf + B x (E[Rmkt] - rf
20.3.1.1. Risk premium
21. EVA
21.1. Measure the value company generates from funds invested
21.1.1. Evan= Cn - r1n-1 - (Depreciation in Period n)
21.1.2. VA = Actual Value
21.1.3. Profitabily Index
21.1.3.1. Value created / Resource Consumed
21.1.3.1.1. NPV / Resource consumed
21.1.4. EVA for a year