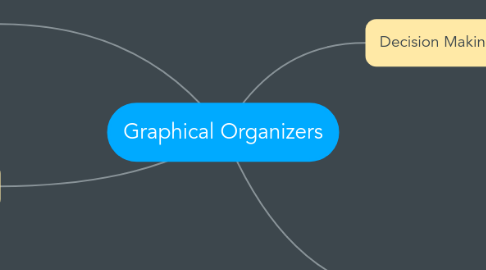
Graphical Organizers
by Michael French


1. Venn Diagrams
1.1. a diagram that shows all possible logical relations between different sets of events. Venn Diagrams illustrate simple set relationships in probability, logic, statistics, linguistics, and computer science.
1.2. They illustrate similarity and differences between two or more different items or beings. Mainly used in terms of comparing and contrasting items.
2. Concept Maps
2.1. A concept map in my mind is like a family tree. You state each point and then draw to the next one, showing the relationship between the two. A Concept map is a family tree but in terms of concepts and the relationships that are drawn when moving from one to another.
2.2. Concept Maps are resourceful when an abundance of different concepts appear, you can shape the map how one desires, along with the freedom to expand as needed.
3. Decision Making Process Grid
3.1. It has many names, including Pugh matrix, solution matrix, decision making matrix, decision grid, problem selection grid, grid analysis, decision matrix analysis
3.2. Pros:
3.2.1. While it breaks things down into 'bite sized' chunks for easy manageability, it also gives a clear view of the overall situation.
3.3. Cons:
3.3.1. It is possible to easily 'skew' the results when a particular result is desired, i.e., when the decision is already made and the decision maker is simply seeking to justify his actions. The other disadvantage is that it keeps the decision making in the cognitive-thinking-rational domain

