
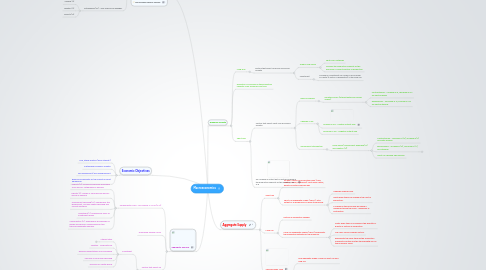
1. The Circular Flow of Income
1.1. GDP = national output (O) = national income (Y) = national expenditure (E)
1.2. Injections (J)
1.2.1. Investment (I)
1.2.2. Government spending (G)
1.2.3. Exports (X)
1.3. Withdrawals (W) - Also referred as leakages
1.3.1. Savings (S)
1.3.2. Taxation (T)
1.3.3. Imports (M)
2. Economic Objectives
2.1. Low, stable inflation (price stability).
2.2. Sustainable Economic Growth.
2.3. Full employment/ low unemployment.
2.4. Balance of payments on the current account equilibrium.
3. Aggregate Demand
3.1. Components of AD - AD formula: C+I+G+(X-M)
3.1.1. Imports (M): Goods and services purchased from abroad - withdrawal of demand.
3.1.2. Exports (X): Goods or services sold abroad - Inflow of demand.
3.1.3. Government spending (G): Spending by the government, includes capital spending and current spending.
3.1.4. Investment (I): Spending by firms on investment goods.
3.1.5. Consumption (C): Spending by households on goods and services. Responsible for two thirds of aggregate demand.
3.2. Downward sloping Curve.
3.3. Factors that affect AD
3.3.1. Investment
3.3.1.1. Interest rates
3.3.1.1.1. New node
3.3.1.2. Taxation - Corporate Tax
3.3.1.3. Business expectations and confidence
3.3.1.4. The level of consumer spending
3.3.1.5. The price of capital goods
3.3.2. Consumption
3.3.2.1. Interest Rates
3.3.2.2. The wealth Effect
3.3.2.3. Perpencity to consume
3.3.2.4. Changes in disposal income
3.3.2.5. Taxation - e.g Income tax
4. Aggregate Supply
4.1. Short-run
4.1.1. At least 1 factor of production fixed. (Land, capital, Labour, Enterprise) Most likely Labour, quality of factors fixed as well.
4.1.2. Short-run Aggregate Supply (SRAS): Total output of all producers in a given time period.
4.1.2.1. Upwards sloping curve.
4.1.2.2. Shifts when there is a change in the cost of production.
4.1.2.3. A change in the price level will cause a movement along the curve - expansion or contraction.
4.2. Long-run
4.2.1. Factors of production variable.
4.2.2. Long-run Aggregate Supply (LRAS): Represents the productive potential of the economy.
4.2.2.1. Shifts when there is a change in the quantity or quality of factors of production.
4.2.2.2. The LRAS curve is always vertical.
4.2.2.3. Represents the same thing as the Production Possibility Frontier and the trend growth line on the Economic Cycle.
4.3. The Keynesian View
4.3.1. One aggregate supply curve for short-run and long-run.
5. Economic Growth
5.1. Long-Run
5.1.1. Factors that affect Long-Run Economic Growth.
5.1.1.1. Supply-Side Policy
5.1.1.1.1. Shift LRAS outwards
5.1.1.1.2. Increase the productive capacity of the economy i.e. affects factors of production.
5.1.1.2. Investment
5.1.1.2.1. Increase in Investment can cause in an increase in capital (a factor of production) in the long-run.
5.2. Definition: An increase in the productive capacity of an economy over time.
5.3. Short-Run
5.3.1. Factors that affect Short-Run Economic Growth
5.3.1.1. Bank of England
5.3.1.1.1. Monetary Policy (Interest Rates and Money Supply)
5.3.1.2. Changes in AD
5.3.1.2.1. Increase in AD - Positive Output Gap
5.3.1.2.2. Decrease in AD - Negative Output Gap
5.3.1.3. Government Intervention
5.3.1.3.1. Fiscal Policy (Government Spending (G) and Taxation (T))
5.3.2. An Increase in output but no actual increase in the productive capacity of the economy. eg. A-B