

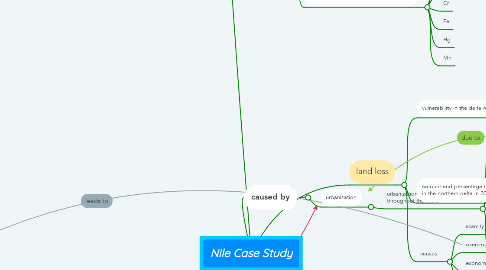
1. caused by
1.1. urbanization
1.1.1. urbanization rate in the Nile River throughout the years
1.1.1.1. 1972
1.1.1.1.1. 3.6% increase
1.1.1.2. 1984
1.1.1.2.1. 4.7% increase
1.1.1.3. 1990
1.1.1.3.1. 5.7% increase
1.1.1.4. 2003
1.1.1.4.1. 10.6% increase
1.1.1.4.2. urbanization rate almost doubled since 1990
1.1.1.5. 2010
1.1.1.5.1. 12.0% increase
1.1.1.5.2. urbanization rate more than tripled since 1972
2. climate change
2.1. impacts
2.1.1. agriculture
2.1.1.1. production
2.1.1.2. consumption by consumers
2.1.1.3. GDP
2.1.1.4. consumer prices
2.1.1.5. change in welfare
2.1.1.6. labor hours
2.1.2. nile flow
2.1.3. global warming
2.1.3.1. people may die from heat stress
2.1.4. rise in sea levels
3. water quality
3.1. water quality indicators
3.1.1. dissolved oxygen
3.1.1.1. limit(5ml/l)
3.1.1.1.1. Gharbia Drain(under limit)
3.1.1.1.2. Omar Bek Drain(under limit)
3.1.1.1.3. Sabal Drain(under limit)
3.1.2. fecal coliforms
3.1.2.1. limit(2000 cfu/100)
3.1.2.1.1. Gharbia Drain(over limit)
3.1.2.1.2. Omar Bek Drain(over limit)
3.1.2.1.3. Sabal Drain(over limit)
3.1.2.2. found in
3.1.2.2.1. human waste
3.1.2.2.2. animal waste
3.1.3. pH values
3.1.3.1. limit(7 - 8.5/std units)
3.1.3.1.1. Gharbia Drain(under limit)
3.1.3.1.2. Omar Bek Drain(under limit)
3.1.3.2. acid
3.1.3.3. alkaline
3.1.4. biochemical oxygen demand
3.1.4.1. limit(10 mg/l)
3.1.4.1.1. Gharbia Drain(over limit)
3.1.4.1.2. Omar Bek Drain(over limit)
3.1.4.1.3. Sabal Drain(over limit)
3.1.4.2. made from
3.1.4.2.1. phosphorous
3.1.4.2.2. oxygen
3.1.5. form of bacteria
3.1.6. total phosphate
3.1.6.1. limit(1 mg/l)
3.1.6.1.1. Gharbia Drain(over limit)
3.1.6.1.2. Sabal Drain(under limit)
3.1.6.1.3. Omar Bek Drain(over limit)
3.1.6.1.4. Sabal Drain(over limit)
3.1.7. nitrates
3.1.7.1. limit(45 mg/l)
3.1.7.1.1. Gharbia Drain(under limit)
3.1.7.1.2. Omar Bek Drain(under limit)
3.1.7.1.3. Sabal Drain(under limit)
3.1.7.2. essential macronutrient in aquatic environments
3.1.7.2.1. temperature change
3.1.7.3. made from
3.1.7.3.1. nitrogen
3.1.7.3.2. oxygen
3.1.8. turbidity
3.1.8.1. limit(100 NTU)
3.1.8.1.1. Gharbia Drain(under limit)
3.1.8.1.2. Omar Bek Drain(under limit)
3.1.8.1.3. Sabal Drain(under limit)
3.1.8.2. a measure of the dispersion of light in a column of water
3.1.8.2.1. due to
3.1.8.3. high levels
3.1.8.3.1. due to
3.1.9. total solids
3.1.9.1. limit(500 mg/l)
3.1.9.1.1. Gharbia Drain(over limit)
3.1.9.1.2. Omar Bek Drain(over limit)
3.1.9.1.3. Sabal Drain(over limit)
3.1.9.2. dissolved and suspended solids materials in water
3.2. capacity of Nile Delta waste water treatment plants
3.2.1. Operational(57%)(3675000m^3/day)
3.2.2. Proposed(30%)(1903000m^3/day)
3.2.3. Constructed & non-operational(13%)(797000m^3/day)
3.3. heavy metals found in the cities along the Nile
3.3.1. Pb
3.3.2. Zn
3.3.3. Cd
3.3.4. Cu
3.3.5. Cr
3.3.6. Fe
3.3.7. Hg
3.3.8. Mn
4. population
4.1. population density
4.1.1. high density in cities along the nile and delta
4.1.2. low density in the outer areas of Egypt(desert area)
4.2. population increase
4.2.1. population nearly quadrupled from 1955 to 2016
4.2.1.1. causes
4.2.1.1.1. overpopulation
4.2.1.1.2. pollution
4.2.1.1.3. high cost of living
4.2.1.1.4. scarcity in resources
4.2.2. projected to be around 125,000,000 people in 2050
5. land loss
5.1. vulnerability in the delta region
5.1.1. north delta
5.1.1.1. very high risk of land degradation
5.1.1.1.1. due to
5.1.1.2. increase in water table
5.1.2. middle delta
5.1.2.1. medium risk of land degradation
5.1.2.2. high water table
5.1.2.3. limited and inflexible crop patterns
5.1.3. south delta
5.1.3.1. high & very high risk of land degradation
5.2. amount and percentage of agricultural lands in the northern delta in 2060
5.2.1. northeast nile delta
5.2.2. north middle nile delta
5.2.3. west nile delta
5.3. causes
5.3.1. scarcity
5.3.1.1. leads to
5.3.1.1.1. mass migration
5.3.2. overcrowding
5.3.3. economic decline
5.3.3.1. leads to
5.3.3.1.1. tourism decline
5.3.4. agriculture loss
6. water access
6.1. sources of Egypt's water supply in 2011-12
6.1.1. share of the nile(55 billion m^3)
6.1.2. groundwater in delta & valley(7.5 billion m^3)
6.1.3. reuse of agricultural water(5.2 billion m^3)
6.1.4. reuse of sewage water(1.3 billion m^3)
6.1.5. rain & floods(0.97 billion m^3)
6.1.6. desalination of sea water(0.6 billion m^3)
6.2. water usage
6.2.1. breakdown
6.2.1.1. 82% agricultural use
6.2.1.2. 10% industrial use
6.2.1.3. 8% domestic use
6.2.2. leads to
6.2.2.1. physical water scarcity
6.2.2.1.1. water resources development is approaching or has reached sustainable limit