

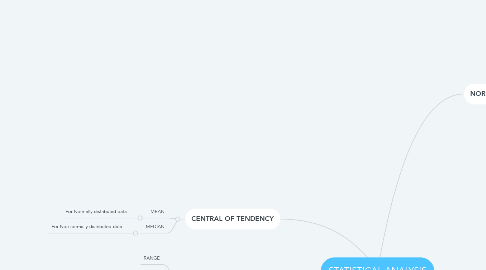
1. CENTRAL OF TENDENCY
1.1. MEAN
1.1.1. For Normally distributed data
1.2. MEDIAN
1.2.1. For Non normally distributed data
2. MEASURE OF DISPERSION
2.1. RANGE
2.2. INTERQUARTILE RANGE (IQR)
2.2.1. For Non normal distributed data
2.3. VARIANCE
2.4. STANDARD DEVIATION
2.4.1. Normal distributed
3. COMPARATIVE STATISTICS
3.1. NORMAL DISTRIBUTION (PARAMETRIC TEST)
3.1.1. DV - CATEGORICAL & IV - CATEGORICAL
3.1.1.1. Chi-square Test
3.1.2. If any of the variable is numerical, transform the data into categorical and do the Chi-square test
3.1.3. DV - NUMERICAL & IV - CATEGORICAL (2 GROUPS)
3.1.3.1. Independent T-Test (Student T-Test)
3.1.4. DV - NUMERICAL & IV - CATEGORICAL (MORE THAN 2 GROUPS)
3.1.4.1. One way Anova
3.1.5. DV - NUMERICAL & IV - REFERENCE VALUE
3.1.5.1. One sample T-Test
3.1.6. DV - NUMERICAL & IV - PRE & POST
3.1.6.1. Dependent T-Test (Paired T-Test)
3.1.7. DV - NUMERICAL & IV - NUMERICAL
3.1.7.1. Pearson Correlation ( if r > 0.7 )
3.1.7.1.1. Simple linear regression
3.2. NON NORMAL DISTRIBUTION ( NON PARAMETRIC TEST
3.2.1. DV - NUMERICAL & IV - CATEGORICAL (2 GROUPS)
3.2.1.1. Mann Whitney U Test
3.2.2. DV - NUMERICAL & IV - CATEGORICAL (MORE THAN 2 GROUPS
3.2.2.1. Kruskall Wallis
3.2.3. DV - NUMERICAL & IV - REFERENCE VALUE
3.2.3.1. Sign Test
3.2.4. DV - NUMERICAL & IV - PRE & POST
3.2.4.1. Wilcoxon Signed Rank Test
3.2.5. DV - NUMERICAL & IV - NUMERICAL
3.2.5.1. Spearmen Test
4. NORMALITY TEST
4.1. SHAPIRO-WILK & KOLMOGOROV - SMIRNOV
4.1.1. If p < 0.05, distribution significantly different compared to normal distribution (not normal)
4.1.2. Normal distribution: p > 0.05; either one test acceptable (normal)
4.2. SKEWNESS
4.2.1. +VE
4.2.2. -VE
4.2.3. Value -1 to +1 indicate approximate bell shape (normal)
4.2.4. Value -3 to +3 away from bell shape (not normal)
4.3. KURTOSIS
4.3.1. Value -1 to +1 (normal)
4.3.2. Value -1 to -3 or +1 to +3 (away from normal)
4.3.3. Value below - 3 or above +3 (certain not normal)
4.4. CRITICAL VALUE
4.4.1. Must be between -1.96 to +1.96
4.4.2. Out of the above range, not normal
4.5. EXTREME VALUES & OUTLIERS
4.5.1. Smallest value
4.5.2. Largest value
4.6. Q-Q PLOT
4.6.1. Normal
4.6.1.1. The points directly fall against straight line (normal)
4.6.2. Detrended normal
4.6.2.1. The points will cluster randomly around the horizontal line at zero with an equal spread above and below the line (normal)
4.6.2.2. Pattern ‘J’ or ‘inverted U’ (not normal)
5. DESCRIPTIVE ANALYSIS
5.1. TYPE OF DATA
5.1.1. Qualitative (categorical)
5.1.1.1. Continuous
5.1.1.1.1. Any value from min to max
5.1.1.1.2. Ex : weight
5.1.1.2. Discrete
5.1.1.2.1. Integers; have gaps between the min and max
5.1.1.2.2. Ex : population
5.1.2. Quantitative (numerical)
6. CORRELATION & REGRESSION
6.1. CORRELATION
6.1.1. To determine the relationship betwen two numerical variables
6.1.2. Pearson correlation (parametric test)
6.1.3. Spearmen correlation (nonparametric test)
6.1.4. The closer to –1, the stronger the negative linear relationship
6.1.5. The closer to 1, the stronger the positive linear relationship
6.1.6. The closer to 0, the weaker any positive linear relationship
6.2. REGRESSION
6.2.1. To determine the relationship between two numerical variables.
6.2.2. To measure which factor effect the outcome
6.2.3. Simple linear regression
6.2.3.1. To describe the relationship between 1 outcome & 1 factor
6.2.3.2. y = mx + c
6.2.4. Multiple linear regression
6.2.4.1. To describe the relationship of 1 outcome & several factors
6.2.5. Multivariable Logistic Regression
6.2.5.1. To describe the association of several factors to a dichotomous outcome
6.2.6. Simple Logistic Regression
6.2.6.1. To describe the relationship between 1 dischotomous outcome & 1 factor