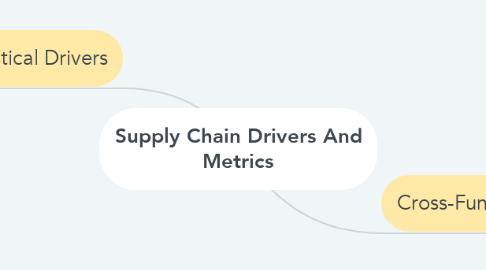
1. Logistical Drivers
1.1. Facilities
1.1.1. Actual physical locations in the supply chain network where product are stored, assembled or fabricated.
1.1.2. 2 major types of facilities
1.1.2.1. Production sites (factories)
1.1.2.1.1. Product Focus
1.1.2.1.2. Functional Focus
1.1.2.2. Storage sites (warehouses)
1.1.2.2.1. Stock keeping unit(SKU) storage
1.1.2.2.2. Job lot storage
1.1.2.2.3. Crossdocking
1.1.3. Facility-related metrics
1.1.3.1. Capacity
1.1.3.2. Utilization
1.1.3.3. Production cost per unit
1.1.3.4. Quality losses
1.1.3.5. Flow time efficiency
1.1.3.6. Product variety
1.1.3.7. Production service level
1.2. Inventory
1.2.1. Encompasses all the raw materials, work in process, and finished goods within a supply chain.
1.2.2. Basic decisions to make regarding the creation and holding of inventory
1.2.2.1. Cycle inventory
1.2.2.2. Safety Inventory
1.2.2.3. Seasonal Inventory
1.2.2.4. Level of product availability
1.2.3. Inventory-related metrics
1.2.3.1. Average inventory
1.2.3.2. Inventory turns
1.2.3.3. Average replishment batch size
1.2.3.4. Average safety inventory
1.2.3.5. Seasonal inventory
1.2.3.6. Fill rate
1.2.3.7. Fraction of time out of stock
1.3. Transportation
1.3.1. Entails moving inventory from point to point in the supply chain.
1.3.2. 6 basic modes of transport
1.3.2.1. Ship
1.3.2.2. Rails
1.3.2.3. Pipelines
1.3.2.4. Trucks
1.3.2.5. Airplanes
1.3.2.6. Electronic transport
1.3.3. Transportation-related metrics
1.3.3.1. Average inbound transportation cost
1.3.3.2. Average income shipment size
1.3.3.3. Average inbound transportation cost per shipment
1.3.3.4. Average outbound transportation cost
1.3.3.5. Average outbound shipment size
1.3.3.6. Average outbound transportation cost per shipment
1.3.3.7. Fraction transported by mode
2. Cross-Functional Drivers
2.1. Information
2.1.1. Connection between various stages of a supply chain, allowing them to coordinate & maximize total supply chain profitability.
2.1.2. Used for the following purpose in a supply chain
2.1.2.1. Coordinating daily activities related to the functioning of other supply chain drivers
2.1.2.2. Forecasting & planning to anticipate and meet future demands
2.1.2.3. Enabling technologies
2.1.3. Information-related metrics
2.1.3.1. Forecast horizon
2.1.3.2. Frequency of update
2.1.3.3. Forecast error
2.1.3.4. Seasonal factors
2.1.3.5. Variance from plan
2.1.3.6. Ratio of demand variability to order variability
2.2. Sourcing
2.2.1. Set of business processes required to purchase goods & services.
2.2.2. Components of sourcing decisions
2.2.2.1. In-House or outsource
2.2.2.2. Supplier selection
2.2.2.3. Procurement
2.2.3. Sourcing-related metrics
2.2.3.1. Days payable outstanding
2.2.3.2. Average purchase price
2.2.3.3. Range of purchase price
2.2.3.4. Average purchase quantity
2.2.3.5. Supply quality
2.2.3.6. Supply lead time
2.2.3.7. Supplier reliability
2.3. Pricing
2.3.1. Determines how much a firm will charge for goods & services that it makes available in the supply chain
2.3.2. Components of Pricing Decisions:
2.3.2.1. Fixed Price vs Menu pricing
2.3.2.2. Every day low pricing vs High-Low pricing
2.3.2.3. Pricing and economies of scale
2.3.3. Pricing-related metrics
2.3.3.1. Profit margin
2.3.3.2. Days sales outstanding
2.3.3.3. Average sale price
2.3.3.4. Average order size
2.3.3.5. Range of sale price
2.3.3.6. Range of periodic sales
2.3.3.7. Incremental fixed cost per order
