
1. The request
1.1. Starting point for analysis
1.2. Have a 30-60 min kickoff meeting with requester
1.2.1. Who's requesting?
1.2.2. What's the motive?
1.2.3. What's the request?
1.2.4. What decision will be made?
1.2.5. Do we have required data?
1.2.5.1. If no data, be up front in saying not possible
2. Analysis Plan
2.1. Don't dive right into some data
2.1.1. Infinite ways to summarize and model
2.1.2. You can spend weeks
2.1.3. And discover nothing you've produced answers the business question proposed
2.1.3.1. This realization is the worst
2.1.3.2. Happens frequently to junior DS
2.2. Have a guardrail
2.2.1. BEFORE looking into data, write down EVERYTHING you plan to do with the data
2.2.2. As analysis progresses, keep track of how much of the plan you've completed
2.2.3. Tells you if you're off the plan
2.2.4. Also allows you to track progress
2.2.5. And keeps you accountable
2.3. Have the items be actionable
2.3.1. "Make a linear regression on sales by region"
2.3.2. "Find out why sales are down"
2.3.3. If actionable, it'll be easy to tell whether you're making progress
2.3.4. Also makes analysis easier
2.4. Template
2.4.1. Top: Objective, Analyst details, Date
2.4.2. Sections
2.4.2.1. Each section is a self-contained topic
2.4.3. Topics
2.4.3.1. 1st level: Lists each question that was posed
2.4.3.2. 2nd level: A list of associated tasks
2.5. Share analysis plan with your manager and stakeholder
2.5.1. They should provide suggestions for improvement
2.5.2. Or approve
2.6. Approved plan should be the foundation of your work
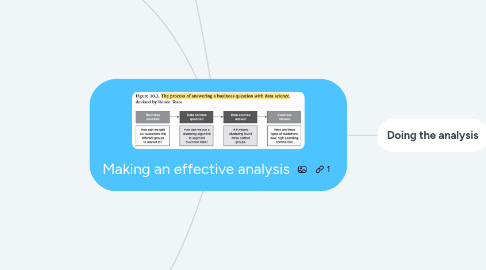
3. Doing the analysis
3.1. Importing and cleaning data
3.1.1. WILL take you more time than you expect
3.1.2. Spend as little time as possible on anything that won't be needed
3.1.3. As much time as possible on work that will help down the line
3.1.4. If stuck, ask for help or find a way to avoid it
3.1.5. Don't keep trying to fix the problem yourself
3.1.6. If you have weird data, don't ignore it!
3.1.6.1. Your analysis will be a waste if the data is not fine
3.1.6.2. Make a mini-analysis to see whether the original analysis is even feasible
3.2. Data exploration and modeling
3.2.1. The vast majority of analysis can be completed by summarizing and transforming data
3.2.1.1. No stat methods, ML needed
3.2.1.2. Still valuable, because others don't have access to data, don't know what transformations to do, or how to do them
3.2.2. Create visualizations or summary tables
3.2.2.1. Keep exploration plots separate from plots you want to share
3.2.3. If you see patterns in data that suggest modeling is a good idea, then do it
3.2.3.1. e.g. time-series model
3.2.3.2. Be sure to output results and visualize them to understand accuracy or usefulness
3.2.3.3. Isolate model-building code from the rest of analysis if this will go to production
3.2.4. Repeat these steps for each point of analysis plan
3.2.5. Structure your plan so that you can reuse some of your code
3.2.6. Extremely easy to waste time by doing work that doesn't support the goal
3.2.6.1. Stay focused on the analysis plan and answering the question the business asked
3.2.6.2. Continually ask yourself, "Is this relevant?"
3.2.7. If you find yourself getting answers that are not useful, stop and take a different approach
3.2.7.1. A dramatically different approach is more likely to succeed than a slight change
3.2.8. Use simple methods instead of complex ones
3.2.8.1. Goal is not to get the best possible accuracy or prediction
3.2.8.2. It is to answer a question in a way that a businessperson can understand
3.2.8.3. You need to explain why you got what you did
3.2.8.4. Compare linear regression with neural net
3.2.9. Keep a slide deck or editable doc that's continuously ready to share
3.2.9.1. Allows you to check in periodically with the requester
3.2.9.2. Shows them your work
3.2.9.3. Frequent check-ins are very important
3.2.9.3.1. DS often neglect to do them
3.2.10. Your analysis should take a one-button press to run
3.2.10.1. e.g. A notebook that loads the data and does the analysis without error
3.3. Wrapping up
3.3.1. Polish your doc if needed, depending on the stakeholder
3.3.2. Craft a narrative for the final doc
3.3.2.1. Think about the story you'd tell them
3.3.2.2. Try to tell that story through your doc
3.3.2.3. Ask if what you're showing will be understandable to your audience
3.3.2.4. When ready, get peer review
3.3.3. You will get questiions
3.3.3.1. Be upfront with what you know and what you don't know
3.3.3.2. OK to say that you need to look into something
3.3.3.3. Gently push back on "What about ___?" requests
3.3.3.3.1. Occasionally useful
3.3.3.3.2. But can easily take your time and not give any new conclusions
3.3.3.3.3. You have to know when to stop
3.3.4. Mothballing your work
3.3.4.1. Rerun the whole analysis, verify no errors
3.3.4.2. Comment your code
3.3.4.3. Add a README
3.3.4.4. Store your code safely
3.3.4.5. Ensure that the data is stored safely
3.3.4.6. Store output in a shared location
4. About
4.1. Answer a one-time question
4.2. Backbone of many DS jobs
4.3. A concise result that clarifies matter at hand is extremely difficult and practically an art
4.4. Good analysis
4.4.1. Answers the question
4.4.2. Made quickly
4.4.2.1. Usually within a month
4.4.3. Can be shared
4.4.4. Self-contained
4.4.4.1. Understandable on its own
4.4.5. Can be revisited
4.5. Report vs Analysis
4.5.1. Report is generated on a recurring basis
4.5.2. Analysis is usually one-time and goes deeper