

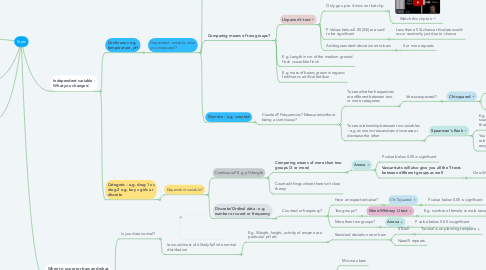
1. Continuous vs Categorical data
1.1. Categorical
1.1.1. Male vs Female
1.1.2. Red light, blue light, green light
1.1.3. Organic fertiliser vs artificial fertiliser
1.2. Continuous
1.2.1. Height, weight, pH, ppm, kPa
1.2.2. Could be at any point in a range of values
1.2.2.1. E.g. 2.15cm vs 2.18cm
1.3. Discrete or ordinal
1.3.1. Can only have a particular value- e.g. numbers
2. U
3. Vassarstats
3.1. Use this to do your stats
4. Independent variable - What you changed
4.1. Continuous e.g. temperature, pH
4.1.1. Dependent variable- what you measured?
4.1.1.1. Continuous - e.g. temperature, CO2 volume produced
4.1.1.1.1. Pearson's regression
4.1.1.1.2. Eg. measured with a ruler/probe/sensor
4.1.1.2. Comparing means of two groups?
4.1.1.2.1. Unpaired t-test
4.1.1.2.2. E.g. Length in cm of the medium ground finch vs warbler finch
4.1.1.2.3. E.g. mass of beans grown in organic fertiliser vs artifical fertiliser
4.1.1.3. Discrete - e.g. counted
4.1.1.3.1. Counted? Frequencies? Measured without being a continuous?
4.2. Categoric - e.g. drug 1 vs drug 2 e.g. boy v girls or discrete
4.2.1. Dependent variable?
4.2.1.1. Continuous? E.g. pH/length
4.2.1.1.1. Comparing means of more than two groups (3 or more)
4.2.1.1.2. Counted things where there isn't clear theory
4.2.1.2. Discrete/Ordinal data - e.g. number or count or frequency
4.2.1.2.1. Counted or frequency?
5. When to use error bars and what type
5.1. Is you data normal?
5.1.1. Ie would most of it likely fall into normal distribution
5.1.1.1. E.g. Weight, height, activity of enzyme at a particular pH etc
5.1.1.1.1. Standard deviation error bars
5.2. Is your data non-normal?
5.2.1. Things where you aren't sure of any theory behind it
5.2.1.1. Use a max-average, average minus min bar
5.2.1.1.1. Min-max bars
5.2.1.1.2. Max is 50, average is 25, max- average = 25. Positive error bar is 25
5.2.1.1.3. Min 22, average is 25m average - min = 3 so negative error bar = 3
5.2.2. Use range bars to show max and min
5.2.3. Distribution
5.2.4. Counted data