
1. windowed user uptime
1.1. SLI
1.1.1. % good user minutes / valid user minutes
1.1.1.1. "for each user" logged activity (fine grain)
1.1.1.2. for each user
1.1.2. Aggreation windows
1.1.2.1. windowed
1.1.2.1.1. simultaneously quantifies SLI at ALL time windows
1.1.2.2. MCR
1.1.2.2.1. Mimimal Cumulative Ratio
1.1.2.2.2. The lowest score of the windows between two time
1.1.2.2.3. example
1.2. CONS
1.2.1. More complex to implement
1.2.2. How to label GOOD/BAD minutes?
1.2.2.1. Time slice
1.2.2.1.1. Time slices
1.2.2.1.2. bounded by two request, aka two state
1.2.2.1.3. Time slice size are not evenly distributed, depends on user activity
1.2.2.2. if before state = after state
1.2.2.2.1. then
1.2.2.2.2. Else
1.2.3. What to do with inactive user minutes?
1.2.3.1. e.g. Vacation time
1.2.3.2. cutoff threshold
1.2.3.2.1. when not status change scince the threshold
1.2.3.2.2. gmail = 30 min as 99th of interarrival request time
1.2.3.3. Example
1.3. PROS
1.3.1. counting minutes is meaning full for human
1.3.2. weigh each user equally
1.3.2.1. meaningfull & proportional
1.3.3. quantify ALL time windows
1.3.3.1. discriminate
1.3.3.1.1. many short outages
1.3.3.1.2. fewer long outages
1.3.3.2. so, is actionable
1.3.3.2.1. Take early counter measure when short frequent outages shows up enable to prevent the fewer long outages
1.3.4. Results
1.3.4.1. Case = 15 min outage over 1 hours
1.3.4.1.1. two user profiles
1.3.4.1.2. Similar SLI AVG, BETTER SLI STDEV
1.3.4.1.3. with retries
2. Parking lot
2.1. MTTF = up time MTTR = down time
2.1.1. what means Failure?
2.1.1.1. a system / all systems?
2.1.1.2. a single user / all users?
3. incident ratio
3.1. SLI
3.1.1. % good system time slices / valid system time slices
3.1.1.1. e.g. up minutes / total minutes
3.1.2. Aggreation windows
3.1.2.1. ussually month or quarter
3.2. PROS
3.2.1. Time proportin is easier to understand for humans
3.2.1.1. Frequently used in SLAs
3.2.2. May be easier to implement
3.2.2.1. E.g. Freshness measured as the % of minutes when the refress queue oldest message age is lower than a threshold
3.2.3. the window match with legal subscrition period (month) or engineering planigication period (quarter)
3.3. CONS
3.3.1. Not meaninfull
3.3.1.1. Does not refect the volume of real user / API interaction
3.3.1.1.1. Backfriday minutes counts equally as low activity volume
3.3.1.2. Does not reflect the proportion of the failure ratio
3.3.1.3. Use artibrary ratio to qualify bad/good minutes
3.3.2. Not actionable
3.3.2.1. Does not apply to large complex distributed systems
3.3.2.1.1. never
4. success ratio
4.1. SLI
4.1.1. % good events / valid events
4.1.1.1. events frequently means (HTTP) request
4.1.2. Aggreation windows
4.1.2.1. ussually 28 days sliding
4.1.2.2. And lower 7d, 12h, last hour
4.1.2.2.1. to enable alerting on burnrate
4.1.2.3. So, somewhat windowed
4.2. PROS
4.2.1. easy to implement on request/response, :error rate, latency
4.2.2. Refect the volume of real user / API interaction
4.2.3. Is countinuously refreshed
4.2.3.1. e.g. every minute
4.2.4. Enable alerting on burnrate
4.3. CONS
4.3.1. Hyper active users (e.g. x1000) are over represented vs regular users
4.3.2. Does not take in account behaviour change during outages
4.3.2.1. User stopping using
4.3.2.1.1. No request represented as no issue while there is one
4.3.2.2. User push on retry without backoff (rate liiting, circuit breakers)
4.3.2.2.1. which means more bad request than percieved
4.3.3. Not usefull when the full service is down, which is rare for large complex distributed ones
4.3.4. Does not discrimitate frequent small incidents
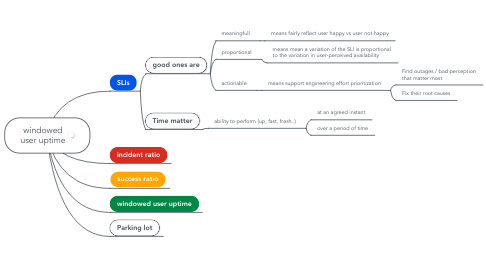
5. SLIs
5.1. good ones are
5.1.1. meaningfull
5.1.1.1. means fairly reflect user happy vs user not happy
5.1.2. proportional
5.1.2.1. means mean a variation of the SLI is proportional to the variation in user-perceived availability
5.1.3. actionable
5.1.3.1. means support engineering effort prioritization
5.1.3.1.1. Find outages / bad perception that matter most
5.1.3.1.2. Fix their root causes
5.2. Time matter
5.2.1. ability to perform (up, fast, fresh..)
5.2.1.1. at an agreed instant
5.2.1.2. over a period of time