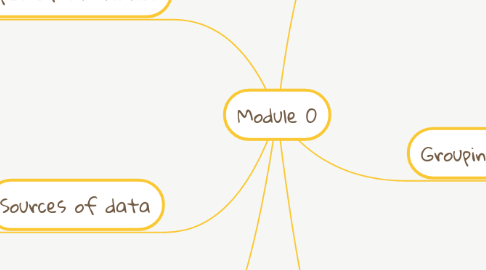
1. Types of statistics
1.1. Descriptive statistics
1.1.1. Collect data
1.1.1.1. Survey
1.1.2. Present data
1.1.2.1. Tables and graphs
1.1.3. Analyze data
1.1.3.1. Sample mean
1.2. Inferential statistics
1.2.1. Draw conclusion about a population by a sample
1.2.2. 1. Estimation
1.2.2.1. ...
1.2.3. 2. Hypothesis testing
1.2.3.1. ...
2. Sources of data
2.1. Primary data
2.1.1. Data collected ourselves
2.1.1.1. Eg: interviews, survey,..
2.2. Secondary data
2.2.1. Data collected by the others
2.2.1.1. Eg: government, journals, publication,....
2.3. Big data
2.3.1. Broad and deep data that arise from ongoing organic distributed processes.
3. Types of data
3.1. Categorical (Qualitative)
3.1.1. Nominal
3.1.1.1. Classifies into categories
3.1.1.1.1. Eg: marital status, hair color,...
3.1.2. Ordinal
3.1.2.1. Ranking involved
3.1.2.1.1. Eg: days of the week, ranking,....
3.2. Numerical (Quantitative)
3.2.1. Discrete (countable items)
3.2.1.1. Counted items (finite number of items)
3.2.1.1.1. Eg: number of children, number of people who have type O blood
3.2.2. Continuous (Measurable items)
3.2.2.1. Measured characteristics (infinite number of items)
3.2.2.1.1. Eg: weight, height,...
4. Business Statistics
4.1. Application of statistics at workplace
4.2. Where to use
4.2.1. Economics
4.2.2. Finance
4.2.3. Marketing
4.2.4. Information system
4.3. Funtions
4.3.1. Processing and analysing data
4.3.2. Assist decision-makers
5. Grouping
5.1. Population
5.1.1. A group of members want to draw a conclusion
5.1.2. Ex:..
5.2. Sample
5.2.1. A portion of the population
5.2.2. Ex:...
5.3. Parameter
5.3.1. Numerical measure for population
5.3.2. Ex:...
5.4. Statistic
5.4.1. Numerical measure for sample
5.4.2. Ex:...
6. Charts
6.1. Categorical data
6.1.1. Summary table
6.1.2. Graphing data
6.1.2.1. Bar charts
6.1.2.1.1. Comparing categories
6.1.2.2. Side-by-side bar charts
6.1.2.3. Pie charts
6.1.2.3.1. Observing the portion of the total
6.2. Numerical data
6.2.1. Frequency distributions
6.2.1.1. Is a summary table in which data are arranged into numerically ordered classes and intervals
6.2.1.2. Histogram
6.2.1.3. Polygon
6.2.1.4. Ogive
6.2.2. Scatter diagram

