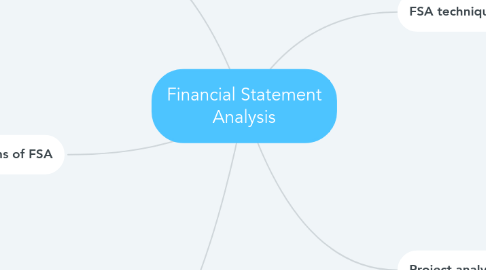
Financial Statement Analysis
作者:Phan Thi Hoang Yen


1. Steps to FSA
1.1. Obtain relevant FS
1.2. Check for consistency
1.3. Undertake preliminary scrutiny of FS
1.4. Collect industry data & general economic trends
1.5. Compare with Industry Avg.
1.6. Do supplementary analysis
1.7. Summarise main features
2. Limitations of FSA
2.1. Prob. with benchmark
2.2. Creative accounting/ Window dressing
2.2.1. Valuation of receivable inventory, property, mktable securities & other A.
2.2.2. L includes off-BS items
2.2.3. Changes in accounting methods
2.3. Historical data
2.4. Qualitative aspects
3. Loan assessment ratios
3.1. D/E
3.2. Current ratio
3.3. CF/ LT debt
3.4. Fixed charge cover
3.5. Net IR earned
3.6. Net profit after tax
3.7. Net profit b4 tax
3.8. Financial leverage
3.9. Inv. T/O in days
3.10. AR T/O in days
4. FSA techniques
4.1. Cross-sectional
4.1.1. Ratio analysis
4.1.1.1. Liquidity ratio (quick ratio, current ratio)
4.1.1.2. Efficiency ratio (Inv T/O ratio, Avg collection period)
4.1.1.3. Profitability ratio (Gross profit-sales ratio, Net profit-sales ratio)
4.1.1.4. Leverage ratio (D/E, Int. coverage ratio)
4.1.2. Common-size statements: percentage of other items on total Assets.
4.2. Time series: evaluate ratio by detecting the improvement/deterioration in financial position
4.3. Combination: using FS & non-FS informations
5. Project analysis
5.1. Techniques
5.1.1. Payback period
5.1.2. Accounting Rate of Return
5.1.3. Discounted CFs (NPV, IRR, benefit-cost ratio)
5.2. Risk analysis
5.2.1. Sensitive analysis
5.2.2. Break-even analysis
5.2.3. Margin of safety
5.2.4. Cash break-even point
