
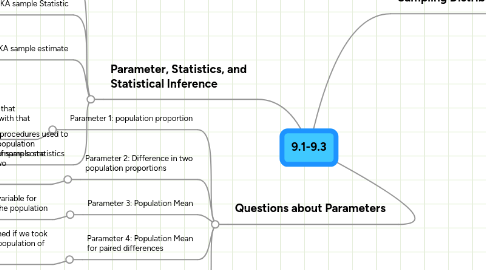
1. Parameter, Statistics, and Statistical Inference
1.1. Parameter: a number that is a summary characteristic of a population
1.1.1. Population Parameter: Makes it clear that the parameter is associated with a population, not a sample
1.2. Statstic: AKA sample Statistic
1.2.1. Sample Statistic: a number computed from sample values taken from a larger population
1.3. Estimate: AKA sample estimate
1.3.1. Sample Estimate: when the statistic is used to estimate the unknown value of a population parameter
1.4. Statistical Inference: The procedures used to make conclusions about population parameters on the basis of sample statistics
1.4.1. Confidence Interval: an interval of values that the researcher is pretty sure will cover the true, unknown value of the population parameter
1.4.2. Hypothesis/Significance Testing: uses sample data to try to reject a hypothesis about the population. Usually to reject the notion that chance can explain the sample results
1.4.2.1. Null Value: a value that would indicate that nothing interesting is happening
1.4.2.2. Statistical Significance: rejecting the idea that the observed results are possible ir the null value is correct
2. Questions about Parameters
2.1. Parameter 1: population proportion
2.1.1. a number between 0 and 1 that represents the proportion with that certain trait
2.2. Parameter 2: Difference in two population proportions
2.2.1. this is used to compare some feature of the two populations
2.3. Parameter 3: Population Mean
2.3.1. the average variable for everyone in the population
2.4. Parameter 4: Population Mean for paired differences
2.4.1. the mean that would be obtained if we took the differences for the entire population of possible pairs
2.4.1.1. Paired differences: data formed by taking the differences in matched pairs
2.5. Parameter 5: Difference in Two Population Means
2.5.1. parameter of interest when comparing the mean for the same quantitative variable in two different populations or two population groups formed by a categorical variable