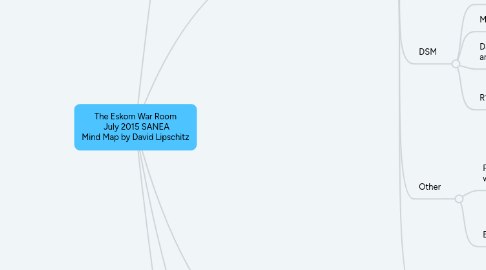
The Eskom War Room July 2015 SANEA Mind Map by David Lipschitz
Eskom War Room talk in July 2015

1. People
1.1. Also African Utility Week
1.2. Ashraf
1.3. Integrated Energy Solutions stats
2. 5 point plan
2.1. Focus
2.1.1. IPP procurement, Demand side management, Draft IRP, Development of the elecricity price plan
2.2. Immediate Measures
2.2.1. Re-deploy managers, maintenance, Eskom Operational Management, Partial Load Losses
2.2.1.1. Trying to move from 72% to 78% energy availability factor by 2020
2.2.2. Restoration
2.2.2.1. Majuba
2.2.2.2. Expedite existing (1000 MW); Coal (2500 MW); 80 possible small scale RE Generation projects (1 to 5 MW); re-commission Ingagane & Vierfontein
2.2.2.2.1. Govt procurement process for the 80 IPPs: Dec 2015
2.2.2.3. Duvha
2.2.2.4. But coal might have run out in the area where the recommissioned power station is
2.2.3. Get online
2.2.3.1. Medupi
2.2.3.1.1. 800 MW by Sep 2015
2.2.3.2. Kusile
2.2.4. Improve management of Load Shedding and reduce confusion; and measuring load shedding (kWh)
2.3. Co-generation
2.3.1. STPPP proposal Negotiation
2.3.2. Compilation and approval at Eskom Investment and Capital Assurance Committee (ICAS)
2.4. Other IPPs
2.4.1. Gas for Power Gen and Additional Sources of Supply
2.5. DSM
2.5.1. R9 to R15 per kWh to the economy [R72?]
2.5.2. Mines, etc, 10% below 2008 levels
2.5.3. Damage to machinery and equipment and labour; investor confidence and social trust not included
2.5.4. R11bil per month
2.5.4.1. R5 per kWh for diesel
2.5.4.2. Eskom average cost is R0.67 per kWh excl new build
2.5.4.2.1. Plus overstaffing, and over paying the staff
2.6. Other
2.6.1. Finance and procurement, skills, regulatory issues, LT issues with ST implications, communications
2.6.1.1. Eskom's liquidity crisis; LT sustainability; LT tariff trajectory
2.6.1.2. Technical skills shortages amongst Eskom's suppliers (expediting Visa applications); technical plant senior managers skills (11 empty positions); additional operating and maintenance staff (141 empty positions)
2.6.2. Eskom reorganisation is required (BPP)
2.7. Gas for Power Generation and Additional Sources of Supply
2.7.1. Namibian floating gas storage plant; Moz gas supply pipeline used by SASOL: Imported LNG, OCGT conversion to gas or LNG
2.7.2. Floating barges as Saldanha
3. War room on electricity
3.1. Structure
3.1.1. Head is Deputy Minister of Energy & Deputy President
3.1.2. EPME, DOE, DPE, DCOG, NT, GCIS, DTI, EDD, Eskom, Contracted Experts
3.1.2.1. DCOG: Dept of Cooperative Governance
3.2. Not specifically electricity, but starting with electricity
3.2.1. Next Phase?
3.2.1.1. KPI's for Eskom's operating divisions
3.3. Many Depts
3.3.1. Coordinate but don't do their work
3.3.2. There is also the Financial Task Team
3.4. address bottlenecks
3.5. Started on 10 Dec 2014
3.5.1. The meet every Friday
3.5.1.1. And they meet with BUSA every second Friday to deal with issues of cooperation
4. SA supply must grow at 5% to meet the NDP goals
5. Questions
5.1. Eskom wants tariff increases, but we have had 4x increases already and we have less electricity; skills training; Medupi, Kusile, Ingula: when will they be completed?
5.2. What about homeowner IPPs?
5.3. Eskom's view is that its better to have a higher tariff so that we don't have load shedding!
5.4. Does the 67 cents per kWh include Medupi and Kusile?
5.4.1. The answer depends on a cost reflective tariff for Eskom where people won't move off the grid