
Graphical Analysis
by Staff.Tom Nelson
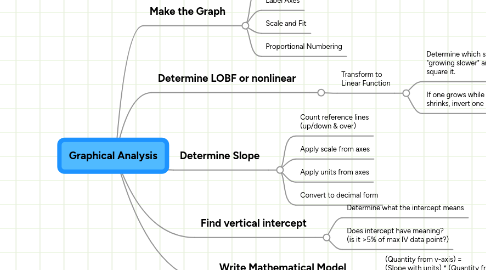
1. Determine Slope
1.1. Count reference lines (up/down & over)
1.2. Apply scale from axes
1.3. Apply units from axes
1.4. Convert to decimal form
2. Determine LOBF or nonlinear
2.1. Transform to Linear Function
2.1.1. Determine which side is "growing slower" and square it.
2.1.2. If one grows while the other shrinks, invert one