

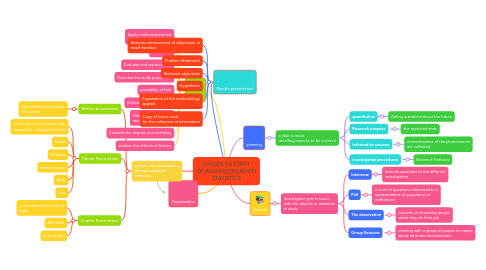
1. Analysis
1.1. Apply mathematical and theoretical methods
1.2. Objectives
1.3. Evaluate and improve data
1.4. Describe the study population
1.5. possibility of bias
1.6. Estimate measurements.
1.7. Estimate measures of association or effect
1.8. Evaluate the degree of uncertainty
1.9. analyze the effects of factors
2. Organization
3. written communication y data presentation statistics
3.1. Written presentation
3.1.1. data series that includes few values
3.2. Tabular Presentation
3.2.1. set of rows andcolumns that respond to a logical ordering
3.2.2. Name
3.2.3. Headers
3.2.4. matrix column
3.2.5. Body
3.2.6. font
3.3. Graphic Presentation
3.3.1. understanding of a set of data
3.3.2. Bar Chart
3.3.3. linear graph
4. Results presentation
4.1. Analyzes achievement of objectives, in result function
4.2. Problem Statement
4.3. Research objectives
4.4. Hypothesis
4.5. Explanation of the methodology applied
4.6. Copy of forms used for the collection of information
5. planning
5.1. a plan is made detailing aspects to be covered
5.1.1. quantitative
5.1.1.1. Asking questions about the future
5.1.2. Research purpose
5.1.2.1. the expected ends
5.1.3. Information sources
5.1.3.1. characteristics of the phenomenon are collected
5.1.4. investigation procedures
5.1.4.1. Research Features
6. Harvest
6.1. Investigator gets in touch with the objects or elements in study
6.1.1. Interview
6.1.1.1. formula questions to the different investigators
6.1.2. Poll
6.1.2.1. is a set of questions addressed to a representative of population or institutions
6.1.3. The observation
6.1.3.1. consists of observing people when they do their job
6.1.4. Group Sessions
6.1.4.1. meeting with a group of people to inquire about attitudes and reactions