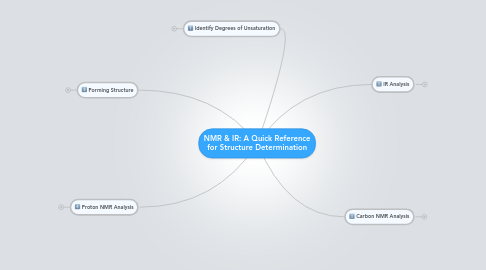
1. Identify Degrees of Unsaturation
1.1. formula: [ [(# of carbons x 2) +2] - # of hydrogens]÷2 = degrees of unsaturation
1.1.1. exceptions to the formula
1.1.1.1. halogen: count as a hydrogen
1.1.1.2. nitrogen: add a carbon
1.1.1.3. oxygen: ignore
1.2. What does this mean?
1.2.1. The degrees of unsaturation of a molecule is the total number of rings and pi bonds.
1.2.2. 4 or more degress of unsaturation suggest the presence of benzene ring
1.3. Tricky groups
1.3.1. Nitro compounds
1.3.1.1. Constitute one degree of unsaturation, but do not show up in IR/NMR
2. Proton NMR Analysis
2.1. Peak Evaluation
2.1.1. 9-12 (Carboxylic Acids)
2.1.2. 9.5-10 (Aldehydes)
2.1.3. 6.5-9 (Aromatic)
2.1.4. 4.5-7 (Vinylic)
2.1.5. 2.5-5 (a-O, N, X)
2.1.6. 2-3 (Acetylenic)
2.1.7. 1.5-2.5 (Allylic, Benzylic, a-Carbonyl)
2.1.8. 0-1.5 (Alkyl)
2.1.9. 0.6-1.1 (R-CH3)
2.1.10. 1.1-1.6 (R-CH2-R)
2.1.11. 1.3-1.7
2.1.12. 1.3-1.7 (R-CH2-R) I R
2.1.13. 1.5-4 (RNH2)
2.1.14. 2-5 (ROH)
2.1.15. 4-7 (PhOH)
2.2. Integration
2.2.1. definition
2.2.1.1. Integration is the area under each signal; this value indicates the number of protons giving rise to the signal.
2.2.2. determining values
2.2.2.1. The computer will produce the area underneath every peak (shown as a numerical value). In order to convert these numbers into useful information, choose the smallest number and then divide all integration values by this number.
2.2.3. using integration values
2.2.3.1. 1H --> could be CH or OH group
2.2.3.2. 2H --> could be CH2 group
2.2.3.3. 3H --> could beCH3
2.2.4. using this information
2.2.4.1. Integration is related to the ratio of equivalent protons, rather than the actual number of protons in a structure.
2.2.4.1.1. equivalance in structures
2.3. Multiplicity
2.3.1. definition
2.3.1.1. The number of peaks in a signal and idicates the number of neighboring protons.
2.3.2. types of splitting patterns
2.3.2.1. singlet
2.3.2.2. doublet (left)
2.3.2.3. quartet
2.3.2.4. quintet (pentet)
2.3.2.5. sextet
2.3.2.6. multiplet proton nmr
2.3.3. What information does this give you?
2.3.3.1. For a proton with n neighbors, its signal will be split into (n+1) lines.
2.4. Neighbors
2.4.1. equation
2.4.1.1. (splitting peaks - 1) = number of neighboring protons
2.5. Shielding
2.5.1. When an atom's nuclei is shielded its NMR frequency will appear more upfield and seen as having a lower chemical shift. When an atom's nuclei is dedshielded its NMR frequency will appear more downfield and seen as having a higher chemical shift.
3. Forming Structure
3.1. Compile Data
3.1.1. What functional groups are present in my molecule?
3.1.2. Do my functional groups agree with the degrees of unsaturation?
3.2. Combine Functional Groups
3.2.1. Use the neighbors of the the functional groups to start to determine where groups could be placed.
3.2.2. Evaluate what peaks were deshielded or shielded to gain clues of which functional groups should be placed together.
3.2.3. Once you have a proposed structure, double check the number of atoms you have with the given chemical formula.
4. IR Analysis
4.1. 2800-3600 (Phenols, Alcohols, and Acids)
4.1.1. ROH
4.2. 3300-3500 (Amides and Amines)
4.2.1. Amides: 3300-3500
4.2.1.1. RCONHR
4.2.2. Amines: 3300-3500
4.2.2.1. R2NH
4.2.2.2. RNH2
4.2.2.2.1. there will be 2 peaks present for RNH2
4.3. 2700-3300 (C-H Bonds)
4.3.1. Csp-H: 3100-3300
4.3.2. Csp2-H: 3000-3200
4.3.3. Csp3-H: 2850-3000
4.3.4. Aldehyde Csp2-H: 2700-2800
4.4. 2100-2260 (sp Region)
4.4.1. Acetylenes: 2100-2260
4.4.2. Nitriles: 2200-2260
4.4.2.1. C≡N
4.5. 1600-1670 (sp2 Region)
4.5.1. Alkenes:1600-1670
4.5.1.1. C=C
4.6. 1640-1800 (Carbonyl Groups)
4.6.1. Acid Chlorides: 1795-1805
4.6.2. Esters: 1725-1740
4.6.2.1. RCO2R
4.6.3. Aldehydes: 1720-1730
4.6.3.1. RCHO
4.6.4. Acids: 1705-1715
4.6.4.1. RCO2H
4.6.5. Ketones: 1705-1715
4.6.5.1. RCOR
4.6.6. Amides: 1645-1655
4.6.6.1. RCONR2
4.6.7. subtract approximately 30 for conjugation with a double bond or aromatic ring
4.6.8. Rings with Carbonyl Groups: 1705-1775
4.6.8.1. Ketones
4.6.8.2. Esters in....
4.6.8.2.1. 6-membered rings: 1725-1735
4.6.8.2.2. 5-membered rings: 1765-1775
4.7. See what same groups appear in Carbon NMR
5. Carbon NMR Analysis
5.1. Hints
5.1.1. The set of three peaks that shows up just before 80ppm is usually solvent
5.1.2. Tall peaks in carbon NMR are usually carbons that have many hydrogen bonds. Conversely, short peaks indicate little to no C-H bonds.
5.1.3. The number of peaks signals the number of carbon environments
5.2. Peak Evaluation
5.2.1. Alkyl: 0-50
5.2.2. C-O,N,X: 10-90
5.2.3. Alkynyl: 70-90
5.2.4. Alkenyl: 100-150
5.2.5. Aromatic: 120-160
5.2.6. Acids, Amides, Esters: 150-170
5.2.7. Aldehydes, Ketones: 190-220
5.2.8. How do these peaks appear in Proton NMR?
