
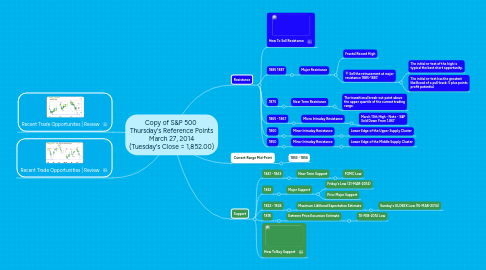
1. Support
1.1. 1841 - 1843
1.1.1. Near Term Support
1.1.1.1. FOMC Low
1.2. 1832
1.2.1. Major Support
1.2.1.1. Friday's Low (21-MAR-2014)
1.2.1.2. Prior Major Support
1.3. 1822 - 1824
1.3.1. Maximum Liklihood Expectation Estimate
1.3.1.1. Sunday's GLOBEX Low (16-MAR-2014)
1.4. 1818
1.4.1. Extreme Price Excursion Estimate
1.4.1.1. 10-FEB-2014 Low
1.5. How To Buy Support
2. Resistance
2.1. How To Sell Resistance
2.2. 1885 1887
2.2.1. Major Resistance
2.2.1.1. Fractal Record High
2.2.1.2. Sell the retracement at major resistance 1885-1887.
2.2.1.2.1. The initial re-test of the high is typical the best short opportunity.
2.2.1.2.2. The initial re-test has the greatest likelihood of a pull-back: 5 plus points profit potential.
2.3. 1875
2.3.1. Near Term Resistance
2.3.1.1. The transitional break-out point above the upper quartile of the current trading range.
2.4. 1865 - 1867
2.4.1. Micro Intraday Resistance
2.4.1.1. March 13th High - Note - S&P Sold Down From 1,867
2.5. 1860
2.5.1. Minor Intraday Resistance
2.5.1.1. Lower Edge of the Upper Supply Cluster
2.6. 1850
2.6.1. Minor Intraday Resistance
2.6.1.1. Lower Edge of the Middle Supply Cluster