
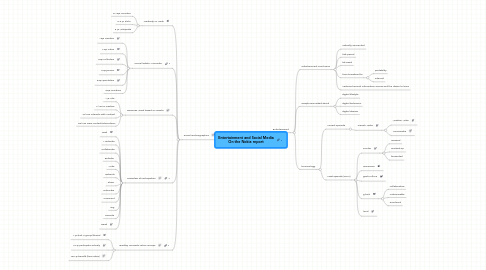
1. Entertainment
1.1. entertainment conclusion
1.1.1. radically reinvented
1.1.2. fast-paced
1.1.3. bit-sized
1.1.4. from broadcast to
1.1.4.1. portability
1.1.4.2. internet
1.1.5. centered around information access and the desire to learn
1.2. sample was asked about
1.2.1. digital lifestyle
1.2.2. digital behaviour
1.2.3. digital desires
1.3. terminology
1.3.1. current episode
1.3.1.1. Transit Media
1.3.1.1.1. Wisdom Wikis
1.3.1.1.2. Micromedia
1.3.2. Next episode (2012)
1.3.2.1. circular
1.3.2.1.1. remixed
1.3.2.1.2. mashed-up
1.3.2.1.3. forwarded
1.3.2.2. immersive
1.3.2.3. geek culture
1.3.2.4. g tech
1.3.2.4.1. collaborative
1.3.2.4.2. customizable
1.3.2.4.3. emotional
1.3.2.5. local
2. Social Technographics
2.1. creativity vs. visits
2.1.1. 0,16% YouTube
2.1.2. 0,2 % Flickr
2.1.3. 5 % Wikipedia
2.2. "social ladder" Forrester
2.2.1. 13% creators
2.2.2. 19% critics
2.2.3. 15% collectors
2.2.4. 19% joiners
2.2.5. 33% spectators
2.2.6. 52% inactives
2.3. Businees Week based on InData
2.3.1. 1 % rule
2.3.2. 1/100 is creative
2.3.3. 10/100 interacts with content
2.3.4. 89/100 view content/interactions
2.4. Powerlaw of Participation
2.4.1. Lead
2.4.2. Moderate
2.4.3. Collaborate
2.4.4. Refactor
2.4.5. Write
2.4.6. Network
2.4.7. Share
2.4.8. Subscribe
2.4.9. Comment
2.4.10. Tag
2.4.11. Favorite
2.4.12. Read
2.5. Bradley Horowitz Yahoo Groups
2.5.1. 1 % start a group/thread
2.5.2. 10 % partcipate actively
2.5.3. 100 % benefit (free riders)