
July 29th, 2014 | S&P 500 Tuesday's Reference Points
저자: Carl Weiss
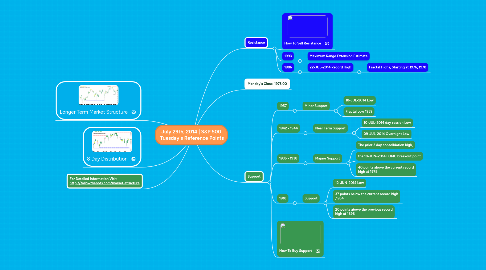
1. Longer Term Market Structure
2. 8 Day Distribution
3. For Detailed Information Visit http://followthebots.com/market-structure
4. Resistance
4.1. How To Sell Resistance
4.2. 1993
4.2.1. Maximum Range Extension Estimate
4.3. 1986
4.3.1. 22-JUL-2014 Record High
4.3.1.1. Fractal Highs, Starting at 1976, 1978
5. Monday's Close 1973.00
6. Support
6.1. 1957
6.1.1. Minor Support
6.1.1.1. 18-JUL-2014 Low
6.1.1.2. Fractal Low 1959
6.2. 1942 - 1944
6.2.1. Near Term Support
6.2.1.1. 10-JUL-2014 day session Low
6.2.1.2. 09-JUL-2014 Overnight Low
6.3. 1936 - 1938
6.3.1. Majaor Support
6.3.1.1. The prior 3 day consolidation high,
6.3.1.2. the 18-JUN-2014 FOMC breakout point
6.3.1.3. 40 points above the current record high at 1978
6.4. 1918
6.4.1. Support
6.4.1.1. 12-JUN-2014 Low
6.4.1.2. 37 points below the current record high ,1954
6.4.1.3. 20 points above the previous record high at 1898