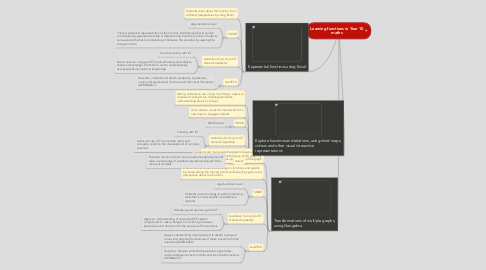
1. Transformations of multiple graphs, using Geogebra
1.1. Students can manipulate the graphs to gain a deep understanding of the transformation of the graph by dragging the axis and moving the scale of the graph
1.2. When students observe the change in functions and graphs by manipulating the turning points and axes, they gain a new perspective about the function.
1.3. SMAR
1.3.1. argumentation level
1.3.2. Students use technology to perform learning tasks that is inconceivable via additional method
1.4. Australian Curriculum ICT General Capability
1.4.1. Managing and operating with ICT
1.4.2. Apply an understanding of networked ICT system components to make changes to functions, processes, procedures and devices to fit the purpose of the solutions
1.5. AusVELS
1.5.1. Apply understanding of polynomials to sketch a range of curves and describe the features of these curves from their equation (ACMNA268)
1.5.2. Describe, interpret and sketch parabolas, hyperbolas, circles and exponential functions and their transformations (ACMNA267)
2. Explore functions and relations, using mind maps, videos and other visual interactive representations
2.1. Asking students to use online mind maps, videos to represent concepts can challenge students' understanding about a concept.
2.2. It can also be use at the introduction of a new topic to engage students
2.3. SMAR
2.3.1. Modification
2.4. Australian Curriculum ICT General Capability
2.4.1. Creating with ICT
2.4.2. select and use ICT to articulate ideas and concepts, and plan the development of complex solutions
2.5. Ausvel
2.5.1. Factorise monic and non-monic quadratic expressions and solve a wide range of quadratic equations derived from a variety of contexts
3. Exponential functions using Excel
3.1. Students learn about this function from different perspectives by using Excel
3.2. SMAR
3.2.1. Argumentation level
3.2.2. There is graphical representation of the function. Additionally, Excel can be simultaneously generated a table of data deriving from the function. Students can evaluate the trend, relationship of between the variables by viewing the change in data
3.3. Australian Curriculum ICT General Capability
3.3.1. Communicating with ICT
3.3.2. Select and use a range of ICT tools efficiently and safely to share and exchange information, and to collaboratively and purposefully construct knowledge
3.4. AusVELS
3.4.1. Describe, interpret and sketch parabolas, hyperbolas, circles and exponential functions and their transformations (ACMNA267)
