The Standard: CCSS.MATH.CONTENT.8.SP.A.1 Construct and interpret scatter plots for bivariate me...

A mind map that describes scaffolding strategies for a unit developed around an eighth grade mathematics standard about scatter plots.

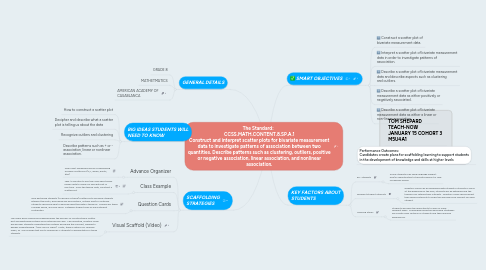
1. GENERAL DETAILS
1.1. GRADE 8
1.2. MATHETMATICS
1.3. AMERICAN ACADEMY OF CASABLANCA
2. BIG IDEAS STUDENTS WILL NEED TO KNOW
2.1. How to construct a scatter plot
2.2. Decipher and describe what a scatter plot is telling us about the data
2.3. Recognize outliers and clustering
2.4. Describe patterns such as + or - association, linear or nonlinear association.
3. SCAFFOLDING STRATEGIES
3.1. Advance Organizer
3.1.1. Flow Chart showing process of developing a proper scatter plot (X,Y, labels, points, title)
3.2. Class Example
3.2.1. Take 10 minutes to poll the class about easily known data to make our own data set in real-time. From the tabular data, construct a scatter plot.
3.3. Question Cards
3.3.1. Give partnered students (or groups of three) scatter plots and have students interpret the plots, describing any associations, outliers and/or clustering. Students should be able to describe what the data is telling us. Groups will teach a nearby group, and vice versa. Establish student roles so each student contributes.
3.4. Visual Scaffold (Video)
3.4.1. The video does a good job breaking down the process of constructing a scatter plot and identifying outliers and clustering very well. This animated, auditory visual aid will help students understand the material and grasp the concept, leading to deeper understanding. (click link for video). Lastly, there's options for Spanish video, so I can provide that link to Spanish ELL students to differentiate for those students.
4. TOM SHEPARD TEACH-NOW JANUARY 15 COHORT 3 M5U4A1
5. SMART OBJECTIVES
5.1. Construct a scatter plot of bivariate measurement data.
5.2. Interpret a scatter plot of bivariate measurement data in order to investigate patterns of association.
5.3. Describe a scatter plot of bivariate measurement data and describe aspects such as clustering and outliers.
5.4. Describe a scatter plot of bivariate measurement data as either positively or negatively associated.
5.5. Describe a scatter plot of bivariate measurement data as either a linear or non-linear association.
6. Performance Outcomes: Candidates create plans for scaffolding learning to support students in the development of knowledge and skills at higher levels
7. KEY FACTORS ABOUT STUDENTS
7.1. ELL Students
7.1.1. Some students may need language support and/or opportunities to translate difficult or new vocabulary words.
7.2. Different Student Interests
7.2.1. Question cards can be developed with students' interests in mind. At the beginning of the year, interests will be gathered and the teacher can catalog their interests. Question cards should reflect their diverse interests to make the learning more relevant for each student.
7.3. Learning Styles
7.3.1. Students will have the opportunity to learn in many different ways. Scaffolding using the described strategies will create many options for students and their learning experiences.