

1. Phase 0: Getting your bearings
1.1. What should I do?
1.1.1. Analyze what are my problems
1.1.2. Identify measures of performance
1.1.3. Identify all resources available for experimentation
1.1.4. Separate in common causes and special causes
1.1.5. Apply a statistical process control
1.2. Methods and techniques that may help us
1.2.1. Process Maping
1.2.2. Pareto Chart
1.2.3. Ishikawa diagram
1.2.4. Control Charts
1.2.5. Other tools
2. Phase 1:The screening experiment
2.1. What should I do?
2.1.1. Propose improvements then of have a stable process.
2.1.2. Identify all the variables posibles that involved mean effects.
2.1.3. Determine the level of each variable (Low "-"and high "+")
2.1.4. Select the variables that have more impacts in the response variable, considering only the variables that are statistically significant.
2.2. Tools
2.2.1. ANOVA
2.2.2. Factorial design
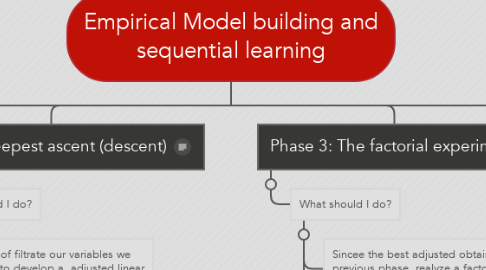
3. Phase 2: Steepest ascent (descent)
3.1. What should I do?
3.1.1. Then of filtrate our variables we have to develop a adjusted linear model,
3.1.2. Recognize the interaction between the significant variables to optimize the response variable.
3.1.3. Prove the best mix to obtain a perfect combination between factors (according to the goal of the experimental design), due exist interaction between them.
4. Phase 3: The factorial experiment
4.1. What should I do?
4.1.1. Sincee the best adjusted obtained in the previous phase realyze a factorial experiments to see interacttions and mean effects.
4.1.2. Analyze the pattern of the residuals and determine if they have a performance like curvature. To see how athe lineal model is adjusted a the real response.
5. Phase 4: The composite design
5.1. What should I do?
5.1.1. Assign a central point over the region where the process is operating to determine a inflexion point.
5.1.2. Take a little experimental steps against to the previous phase.
5.1.3. Analyze the degree freedom to stimate the error.
5.1.4. Realyze a canonical analysis to found the S point stationary.
5.1.5. Optimize the levels of the factors.
5.2. Tools
5.2.1. EVOP, to minimize the risk of have several deffects.
5.2.2. ANOVA
5.2.3. Contour plots
6. Phase 5: Robust product and process design
6.1. What should I do?
6.1.1. Create process and products (response variables) that operate in optimal conditions.
6.1.2. It provides a filter between the customer and defect product that occurs during the learning process.
6.1.3. Integration of a robust design.
6.2. Tools
6.2.1. Taguchi judgment
6.2.1.1. To integrate the DOE, product and design process.
6.2.1.2. Categories
6.2.1.2.1. Quality control out of line.
6.2.1.2.2. Quality control into the production line
6.2.1.2.3. Expected loss