
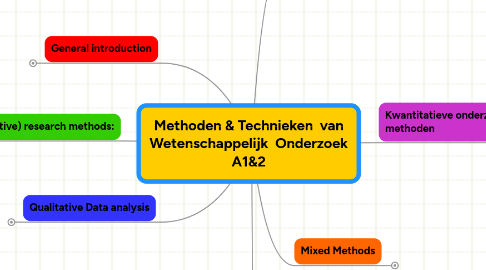
1. General introduction
1.1. H1
1.1.1. The Nature of Social Scientific Research
1.1.1.1. wat?
1.1.1.1.1. Academic research on topics, related to questions, relevant to social scientific field
1.1.1.2. Waarom?
1.1.1.2.1. A gap in our knowledge/ understanding of what goes on in society
1.1.1.3. inspiratiebronnen
1.1.1.3.1. society itself
1.1.1.3.2. literature/theory
1.1.1.4. Link to Theory is critical!
1.1.1.4.1. otherwise ‘only fact-finding’ => empiricism
1.1.1.4.2. Deductief (p10)
1.1.1.4.3. Inductief
1.1.1.4.4. Grand theory vs middle range theory
1.1.1.5. Quantitative vs qualitative research
1.1.1.5.1. Quantitative research
1.1.1.5.2. Qualitative research
1.1.1.6. Epistemology – kennisleer
1.1.1.6.1. How do you gather knowledge?
1.1.1.7. Ontology – wereldbeeld
1.1.1.7.1. How is the world constructed?
1.1.1.8. Values – Practical considerations
1.1.1.8.1. Values: Personal beliefs or the feelings of researcher
1.1.1.8.2. Practical considerations
1.2. H2
1.2.1. Research Designs
1.2.1.1. 1. What is a Research Design?
1.2.1.1.1. Based upon Research Question
1.2.1.1.2. “A framework to guide data collection & analysis”
1.2.1.1.3. Differs from:
1.2.1.2. 2. Five research designs:
1.2.1.2.1. A. Experimental design
1.2.1.2.2. B. Cross-sectional design
1.2.1.2.3. C. Longitudinal design
1.2.1.2.4. D. Case study design
1.2.1.2.5. E. Comparative design
1.2.1.2.6. Learn strengths/weaknesses of each of the five designs!
1.2.1.3. 3. Criteria for Social Research
1.2.1.3.1. 1. Reliability
1.2.1.3.2. 2. Replication
1.2.1.3.3. 3. validity
1.2.1.3.4. These criteria primarily in quantitative research
1.3. H3
1.3.1. Research Question
1.3.1.1. Planning a Research Project (P. 71)
1.3.1.1.1. 1. Define research area
1.3.1.1.2. 2. Look at specific gap
1.3.1.1.3. 3. Various research questions
1.3.1.1.4. 4. Selection of key research question
1.3.1.2. Formulating Research Questions
1.3.1.2.1. Research questions help to guide:
1.3.1.2.2. Criteria for Suitable Research Questions
1.4. H4
1.4.1. Literature Review
1.4.1.1. 1. Why literature review?
1.4.1.1.1. “Not to simply reinvent the wheel”
1.4.1.1.2. Affirming credibility as researcher
1.4.1.1.3. Revise and refine research questions
1.4.1.1.4. Develop argument about the relevance of your research & where it leads
1.4.1.1.5. More specifically:
1.4.1.2. 2. Getting most from your reading (p. 102)
1.4.1.2.1. 1.Bibliography
1.4.1.2.2. 2. Critical reading skills
1.4.1.2.3. 3. Continue to read
1.4.1.2.4. 4. Develop a story
1.4.1.3. 3. Types of literature review
1.4.1.3.1. 1. Systematic Review
1.4.1.3.2. 2. Narrative Review
1.4.1.4. 4. Practical tips for literature review (p. 95-101)
1.4.1.5. 5. Referencing your work (p.101-107)
2. (Qualitative) research methods:
2.1. H16
2.1.1. The Nature of Qualitative Research
2.1.1.1. 1. What is qualitative research?
2.1.1.1.1. Def: A research strategy that emphasizes on words rather than quantification in the collection & analysis of data”
2.1.1.1.2. Inductive in nature
2.1.1.1.3. Constructionism
2.1.1.1.4. Interpretivism
2.1.1.1.5. Different research methods:
2.1.1.2. 2. Main steps in qualitative research? (p. 370)
2.1.1.3. 3. Theory – Data & Concepts
2.1.1.3.1. Inductive in nature
2.1.1.3.2. Theory-building
2.1.1.3.3. Different types of concepts:
2.1.1.4. 4. Sampling
2.1.1.4.1. 1. Probability sampling
2.1.1.4.2. 2. Purposive sampling:
2.1.1.5. 5. Criteria for qualitative research
2.1.1.5.1. Degree of realism => 3 popular schools
2.1.1.6. 6. Key features qualitative research
2.1.1.6.1. 1. seeing through the eyes of those studied
2.1.1.6.2. 2. Description and emphasis on context
2.1.1.6.3. 3. Emphasis on social process
2.1.1.6.4. 4. Flexibility and limited structure
2.1.1.6.5. 5. Concepts and theory emerge from the data
2.1.1.7. 7. qualitative research critiques
2.1.1.7.1. 1. Too subjective => researcher decides what to focus on
2.1.1.7.2. 2. Difficult to replicate => unstructured format
2.1.1.7.3. 3. Problems of generalization => samples not ‘representative’ of all cases
2.1.1.7.4. 4. Lack of transparency => often unclear what researcher actually did
2.1.1.8. 8.Differences in relation to quantitative research
2.1.1.8.1. See page 393
2.1.1.9. 9.Similarities in relation to quantitative research
2.1.1.9.1. Both about data reduction
2.1.1.9.2. Seek to answer research questions
2.1.1.9.3. Relating data analysis to research literature
2.1.1.9.4. Concerned with variation
2.1.1.9.5. Avoid deliberate distortion
2.2. H17
2.2.1. Ethnography & Participatory Observation
2.2.1.1. 1. What is ethnography
2.2.1.1.1. Take part in people’s everyday life in a particular social setting for an extensive period of time
2.2.1.1.2. Interest in the way people live & how they give meaning to that life
2.2.1.1.3. Focus on behaviour, culture, rituals, norms, etc.
2.2.1.1.4. Participatory observation, informal interview, ‘hanging around’
2.2.1.1.5. Writing a detailed account of a particular setting
2.2.1.1.6. Example: ‘Gang leader for a day’ - Venkatesh
2.2.1.1.7. Note. Ethnography is both a research method & the written product of research
2.2.1.2. 2. How to get access?
2.2.1.2.1. A. overt vs. covert role as ethnographer
2.2.1.2.2. B. open/public vs. closed settings
2.2.1.2.3. 3 types of collection:
2.2.1.2.4. How to keep ensuring access?
2.2.1.2.5. Credibility as ethnographer:
2.2.1.2.6. Role of key informants
2.2.1.3. 3. Level of participation
2.2.1.3.1. 1. Complete observer => No interaction at all
2.2.1.3.2. 2. Observer-as-participant => Limited level of involvement
2.2.1.3.3. 3. Participant-as-observer => Participate in an overt role – others are aware of your role as researcher
2.2.1.3.4. 4. Participant => Covert role – others are UNAWARE of your research intentions
2.2.1.3.5. Always evaluate your own position!!
2.2.1.4. 4. Purposive sampling
2.2.1.4.1. In function of the research question
2.2.1.4.2. Theory-Oriented
2.2.1.4.3. 3 subtypes:
2.2.1.4.4. Theoretical saturation:
2.2.1.5. 5. Taking field notes
2.2.1.5.1. Write down notes as soon as possible after events
2.2.1.5.2. Be vivid and clear – detailed descriptions
2.2.1.5.3. Danger of dictaphone or taking notes
2.2.1.5.4. Three types of field notes:
2.2.1.6. 6. When & how to end?
2.2.1.6.1. 1. Practical considerations
2.2.1.6.2. 2. Emotional pressure, situation too risky
2.2.1.6.3. 3. Situation seizes to exist
2.2.1.6.4. 4. Reached the theoretical saturation point
2.2.1.7. 7. The rise of visual ethnography
2.2.1.7.1. 2 types of materials:
2.2.1.7.2. Research position:
2.3. H18
2.3.1. Interviewing in Qualitative Research
2.3.1.1. 1. What is qualitative interviewing?
2.3.1.1.1. Less structured/standardized then Structured interview
2.3.1.1.2. Take the participant’s viewpoint
2.3.1.1.3. Encourage ‘rambling’ off the topic
2.3.1.1.4. Rich, detailed answers
2.3.1.1.5. Aim to understand rather than to generalize
2.3.1.2. 2. Types of qualitative interviewing
2.3.1.2.1. Unstructured interview
2.3.1.2.2. Semi-structured interview
2.3.1.2.3. Life history interview
2.3.1.2.4. Oral history interview
2.3.1.3. 3. How to do qualitative interviewing
2.3.1.3.1. Preparing an interview guide:
2.3.1.3.2. Kinds of questions:
2.3.1.3.3. What makes a good interviewer?
2.3.1.4. 4. Recording & transcription
2.3.1.4.1. Why?
2.3.1.4.2. Keep in mind!! 1 hour interview = 5-6 hours transcription
2.3.1.4.3. Selective transcription saves time
2.3.1.5. 5. Purposive Sampling
2.3.1.5.1. Select interviewees who are relevant to your research questions
2.3.1.5.2. Snowball sampling => Useful when no sampling frame
2.3.1.5.3. Theoretical sampling
2.3.1.6. 6. Benefits of qualitative interviewing
2.3.1.6.1. Qualitative Interviewing
2.3.1.6.2. Participatory Observation
2.3.1.6.3. See pages 465-466
2.4. H19
2.4.1. Focus groups
2.4.1.1. 1. What is a focus group?
2.4.1.1.1. Form of a group interview
2.4.1.1.2. Several participants & moderator
2.4.1.1.3. Discuss a specific issue
2.4.1.1.4. Study the interaction between group members
2.4.1.1.5. Are opinions expressed & modified through the group discussions?
2.4.1.2. 2. Use of focus groups
2.4.1.2.1. constructionist world view
2.4.1.2.2. to understand why people hold certain views
2.4.1.2.3. A wide range of views
2.4.1.2.4. Media and cultural studies
2.4.1.3. 3. Conducting focus groups
2.4.1.3.1. Recording & transcription:
2.4.1.3.2. Number of focus groups:
2.4.1.3.3. Size of focus groups:
2.4.1.4. 4. Level of moderator involvement
2.4.1.4.1. Be unobtrusive & non-directive
2.4.1.4.2. Questions:
2.4.1.4.3. Beginning:
2.4.1.4.4. Ending:
2.4.1.5. 5. Role of group interaction
2.4.1.5.1. Selection of participants:
2.4.1.5.2. Group interaction:
2.4.1.6. 6. Limitations of focus groups
2.4.1.6.1. Researcher has less control over proceedings
2.4.1.6.2. Data are more difficult to manage
2.4.1.6.3. Difficult to organize/risk of no-shows
2.4.1.6.4. Transcription is time consuming
2.4.1.6.5. Groupthink’/ social desirability
2.4.1.6.6. Potential to cause discomfort
2.5. H20
2.5.1. Language in Qualitative Research
2.5.1.1. 1. Functions of language in social research:
2.5.1.1.1. 1. Language as a resource of information
2.5.1.1.2. 2. Language as a topic in itself
2.5.1.2. 2. Conversation analysis (CA)
2.5.1.2.1. What?
2.5.1.2.2. Features?
2.5.1.2.3. Key assumptions:
2.5.1.2.4. Basic analytic tools:
2.5.1.3. 3. Discourse analysis (DA)
2.5.1.3.1. What?
2.5.1.3.2. Key features:
2.5.1.3.3. 2 main goals:
2.5.1.3.4. Critical discourse analysis
2.5.1.4. 4. Differences & Similarities
2.5.1.4.1. Both focus on language & context
2.5.1.4.2. DA more flexible than CA in looking beyond immediate context of talk
2.5.1.4.3. DA recognizes the wider socio-cultural & political context
2.5.1.4.4. Epistemological: CA almost positivist in nature while DA departs from a more interpretivist stance
2.6. H21
2.6.1. Documents as Sources of Data
2.6.1.1. 1. Documents as topic of research
2.6.1.1.1. use of extant documents!
2.6.1.1.2. Have been preserved & available for analysis
2.6.1.1.3. Unobtrusive & non-reactive method
2.6.1.1.4. 4 Criteria for evaluation:
2.6.1.2. 2. Type of documents
2.6.1.2.1. 1. Personal Documents
2.6.1.2.2. 2. Official documents
2.6.1.2.3. 3. Mass-media outputs
2.6.1.2.4. 4. Virtual documents
2.6.1.2.5. Evaluate each of them according to the 4 criteria
2.6.1.3. 3. The world as a text
2.6.1.3.1. Reading world as a ‘text’
2.6.1.3.2. Readers/audiences
2.6.1.4. 4. Interpreting documents
2.6.1.4.1. 3 types of studying documents:
3. Qualitative Data analysis
3.1. H22
3.1.1. Qualitative Data Analysis
3.1.1.1. 1. What is qualitative data analysis?
3.1.1.1.1. After collection of data, time for analysis:
3.1.1.1.2. Typical to qualitative data analysis:
3.1.1.2. 2. Analytic induction
3.1.1.2.1. What?
3.1.1.2.2. Steps
3.1.1.2.3. Key problems:
3.1.1.2.4. See pages 539-541
3.1.1.3. 3. Grounded theory
3.1.1.3.1. Main features:
3.1.1.3.2. Tools of grounded theory:
3.1.1.3.3. Outcomes of grounded theory:
3.1.1.3.4. Criticisms on grounded theory:
3.1.1.4. 4. Basic operations in qualitative data analysis
3.1.1.4.1. 1. How to code?
3.1.1.4.2. 2. Turning data into fragments:
3.1.1.4.3. 3. Problems with coding:
3.1.1.5. 5. Narrative analysis
3.1.1.5.1. Key features:
3.1.1.6. 6. Secondary analysis of qualitative data
3.1.1.6.1. Analysis of the data already analyzed
3.1.1.6.2. Compare own interpretation with original reading
3.1.1.6.3. More in-depth analysis
3.1.1.6.4. Disadvantages:
4. Kwantitatieve onderzoeks methoden
4.1. H6
4.1.1. The Nature of Quantitative Research
4.1.1.1. 1. Means steps in quantitative research
4.1.1.1.1. See pages 140-141
4.1.1.1.2. 1. THEORY:
4.1.1.1.3. 2. Hypothesis:
4.1.1.1.4. 3. RESEARCH DESIGN:
4.1.1.1.5. 4. CONCEPTS – OPERATIONALISATION
4.1.1.1.6. 5. SELECTION RESEARCH SITES
4.1.1.1.7. 6. SAMPLING
4.1.1.1.8. 7. ADMINISTER INSTRUMENTS
4.1.1.1.9. 8. PROCESS DATA
4.1.1.1.10. 9. ANALYSIS
4.1.1.1.11. 10. FINDINGS/CONCLUSION
4.1.1.2. 2. Concepts
4.1.1.2.1. WHAT ARE CONCEPTS?
4.1.1.2.2. WHY TO MEASURE?
4.1.1.2.3. HOW TO MEASURE?
4.1.1.3. 3. Reliability & validity
4.1.1.3.1. RELIABILITY OF YOUR INSTRUMENT
4.1.1.3.2. VALIDITY - FOCUS HERE ON MEASURE VALIDITY:
4.1.1.3.3. 6 criteria ( chapter 2.3)
4.1.1.3.4. VALIDITY PRESUPPOSES RELIABILITY!
4.1.1.4. 4. Mean concerns of quantitative researcher
4.1.1.4.1. 1. MEASUREMENT
4.1.1.4.2. 2. CAUSALITY
4.1.1.4.3. 3. GENERALIZATION
4.1.1.4.4. 4. REPLICATION
4.1.1.5. 5. Criticisms of quantitative research
4.1.1.5.1. 1. FAILURE TO DISTINGUISH BETWEEN OBJECTS IN THE NATURAL WORLD & SOCIAL PHENOMENA
4.1.1.5.2. 2. OVERLY FOCUS ON PRECISION AND ACCURACY
4.1.1.5.3. 3. LACK OF ECOLOGICAL VALIDITY
4.1.1.5.4. 4. STATIC VIEW OF SOCIAL LIFE
4.1.1.6. 6. Exceptions
4.1.1.6.1. Discrepancy between ideal type & actual practice of social research
4.1.1.6.2. 1. REVERSE OPERATIONISM
4.1.1.6.3. 2. RELIABILITY & VALIDITY TESTING
4.1.1.6.4. 3. SAMPLING
4.2. H7
4.2.1. Sampling
4.2.1.1. 1. What is sampling?
4.2.1.1.1. Sample: the segment of the population (=universe of units -> not necessarily people, but also nations, cities, firms, etc) that is selected for investigation.
4.2.1.1.2. OFTEN POPULATION IS TOO LARGE =>Need to take A SAMPLE
4.2.1.1.3. Preferably the sample has to be representative in order to generalize back to the population
4.2.1.1.4. SAMPLING OF PEOPLE, TIME/DATE, MEDIA
4.2.1.2. 2. Different steps of sampling
4.2.1.2.1. 1. POPULATION:
4.2.1.2.2. 2. SAMPLE:
4.2.1.2.3. 3. SAMPLING FRAME:
4.2.1.2.4. 4. REPRESENTATIVE SAMPLE:
4.2.1.2.5. 5. SAMPLE BIAS:
4.2.1.2.6. 6. DANGER OF SAMPLING ERROR
4.2.1.2.7. PREFERENCE IN QUANTITATIVE RESEARCH FOR PROBABILITY SAMPLING!
4.2.1.3. 3. Types of probability sampling
4.2.1.3.1. 1. SIMPLE RANDOM SAMPLING
4.2.1.3.2. 2. SYSTEMATIC RANDOM SAMPLING
4.2.1.3.3. 3. STRATIFIED RANDOM SAMPLING
4.2.1.3.4. 4. MULTI-STAGE CLUSTER SAMPLING
4.2.1.4. 4. Qualities/Benefits of probability sampling
4.2.1.4.1. Benefit: Allows generalizations about the population
4.2.1.4.2. Limits: Not beyond the population
4.2.1.5. 5.Sample size
4.2.1.5.1. ABSOLUTE SIZE MATTERS MORE THAN RELATIVE SIZE
4.2.1.5.2. THE LARGER THE SAMPLE = THE MORE PRECISE
4.2.1.5.3. RESPONSE RATE
4.2.1.5.4. HETEROGENEITY OF THE POPULATION
4.2.1.5.5. TYPE OF ANALYSIS TO BE CARRIED OUT
4.2.1.6. 6. Types of non-probability sampling
4.2.1.6.1. 1. CONVENIENCE SAMPLING
4.2.1.6.2. 2. SNOWBALL SAMPLING
4.2.1.6.3. 3. QUOTA SAMPLING
4.2.1.7. 7. Error in survey research
4.2.1.7.1. Sampling error
4.2.1.7.2. Data collection error
4.2.1.7.3. Data processing error
4.3. H8
4.3.1. Structured Interviewing
4.3.1.1. 1. What is a structured interview?
4.3.1.1.1. Key method in quantitative research
4.3.1.1.2. STANDARDIZED INTERVIEW SCHEDULE
4.3.1.1.3. DIFFERENCE IN RESPONSES ONLY TO BE ATTRIBUTED “TO TRUE VARIATION”
4.3.1.1.4. Avoid Interviewer variability
4.3.1.2. 2. Conducting structured interviews
4.3.1.2.1. CLOSED QUESTIONS
4.3.1.2.2. PRE-CODED
4.3.1.2.3. Steps
4.3.1.3. 3. How to avoid measurement errors?
4.3.1.3.1. 1. AVOID ERROR DUE TO INTERVIEWER VARIABILITY
4.3.1.3.2. 2. AVOID ERROR DUE TO DATA PROCESSING
4.3.1.3.3. 3. INTERVIEW CONTEXT
4.3.1.4. 4. Problems with structured interviewing
4.3.1.4.1. CHARACTERISTICS OF INTERVIEWERS
4.3.1.4.2. RESPONSE SETS
4.3.1.4.3. THE PROBLEM OF MEANING
4.4. H9
4.4.1. Self-completion Questionnaires
4.4.1.1. 1. What is a self-completion questionnaire (SCQ)?
4.4.1.1.1. -NO INTERVIEWER present -Respondent writes answers on form -Returned to researcher or deposited for collection -Postal questionnaires -Distributed in person/by email/online
4.4.1.2. 2. Advantages/Disadvantages of SCQ
4.4.1.2.1. TYPICAL OF SCQ:
4.4.1.2.2. ADVANTAGES OF SCQ:
4.4.1.2.3. DISADVANTAGES OF SCQ:
4.4.1.3. 3. Response-rate & how to improve?
4.4.1.3.1. Relatively low => Risk of sample bias
4.4.1.3.2. 60-70% = acceptable
4.4.1.3.3. Strategies to improve response rates:
4.4.1.4. 4. How to design a SCQ?
4.4.1.4.1. 1. UNCLUTTERED LAYOUT
4.4.1.4.2. 2. CLEAR PRESENTATION
4.4.1.4.3. 3. VERTICAL ALIGNMENT OF FIXED CHOICE ANSWERS
4.4.1.4.4. 4. CLEAR INSTRUCTIONS
4.4.1.4.5. 5. KEEP QUESTIONS AND ANSWERS TOGETHER
4.4.1.5. 5. Diaries as a form of SCQ
4.4.1.5.1. RESEARCHER-DRIVEN DIARIES
4.4.1.5.2. Alternative to structured observation in quantitative research
4.4.1.5.3. STRUCTURED DIARY
4.4.1.5.4. TIME-USE DIARY
4.4.1.5.5. Advantages
4.4.1.5.6. Disadvantages
4.5. H10
4.5.1. Asking Questions
4.5.1.1. 1. Open vs closed questions
4.5.1.1.1. Open questions
4.5.1.1.2. Closed questions
4.5.1.1.3. coding
4.5.1.2. 2. Types of questions
4.5.1.2.1. - Personal factual questions - Factual questions about others - Informant factual questions - Attitudes (houding) - Beliefs (overtuigingen) - Normative standards & values - Lay knowledge (vragen over kennis: ken je...?) - for example: see sheets
4.5.1.3. 3. Designing questions: Rules of thumb
4.5.1.3.1. 1. REMEMBER YOUR RESEARCH QUESTIONS
4.5.1.3.2. 2. DECIDE EXACTLY WHAT YOU WANT TO FIND OUT
4.5.1.3.3. 3. IMAGINE YOURSELF AS A RESPONDENT
4.5.1.3.4. Please look into the commonly made mistakes p.240-245!
4.5.1.3.5. Specifiekere regels
4.5.1.4. 4. Vignette questions
4.5.1.4.1. Present a scenario
4.5.1.4.2. Ask them how they would respond or what they think the characters should do
4.5.1.4.3. Useful for sensitive topics
4.5.1.5. 5. Piloting and pre-testing questions
4.5.1.5.1. CHECK THAT THE RESEARCH INSTRUMENT WORKS
4.5.1.5.2. OPEN QUESTIONS CAN GENERATE FIXED CHOICE ANSWERS TO INCLUDE IN THE FINAL STUDY
4.5.1.5.3. PILOT RESPONDENTS SHOULD NOT BE IN FINAL SAMPLE!
4.5.1.6. 6. Using existing questions
4.5.1.6.1. Questions have already been piloted
4.5.1.6.2. Known properties of reliability & validity
4.5.1.6.3. Helps you to draw comparisons with other studies
4.5.1.6.4. ‘QUESTION BANKS’ Repositories of questions used in previous surveys http://qb.soc.surrey.ac.uk/
4.6. H11
4.6.1. Structured Observation
4.6.1.1. 1. What is structured observation?
4.6.1.1.1. Research method to SYSTEMATICALLY OBSERVE respondents’ BEHAVIOUR
4.6.1.1.2. EXPLICIT RULES for observation/coding
4.6.1.1.3. Rigid OBSERVATION SCHEDULE
4.6.1.1.4. FIXED SET OF CATEGORIES TO MEASURE PEOPLE’S ACTIVITY
4.6.1.1.5. Aggregate & compare behaviour IN THE SAMPLE
4.6.1.1.6. Popular in cross-sectional research design
4.6.1.2. 2. Advantages of structured observation
4.6.1.2.1. Observation overcomes typical problems of social survey:
4.6.1.3. 3. Observation schedule/observation strategies?
4.6.1.3.1. A. OBSERVATION SCHEDULE:
4.6.1.3.2. B. OBSERVATION STRATEGIES:
4.6.1.4. 4. Sampling in structured observation
4.6.1.4.1. 1. SAMPLING PEOPLE: Random sample of individuals to observe
4.6.1.4.2. 2. SAMPLING TIME PERIODS Observe same individual(s), at randomly selected times
4.6.1.4.3. CANNOT ALWAYS USE PROBABILITY SAMPLING => No sampling frame for public encounters
4.6.1.4.4. LIMITED EXTERNAL VALIDITY, If conducted over a short span of time
4.6.1.5. 5. Reliability & validity
4.6.1.5.1. RELIABILITY
4.6.1.5.2. MEASUREMENT VALIDITY
4.6.1.6. 6. Field stimulation
4.6.1.6.1. Researcher directly intervenes in a setting & observes the results
4.6.1.6.2. CONTRIVED OBSERVATION
4.6.1.6.3. Quasi-experimental design
4.6.1.7. 7. Criticisms of structured observation
4.6.1.7.1. - IMPOSING AN IRRELEVANT FRAMEWORK on the social setting - NEGLECTS THE MEANINGS/INTENTIONS BEHIND BEHAVIOUR - Ignores the SOCIAL CONTEXT OF BEHAVIOUR - GENERATES FRAGMENTED DATA – difficult to see the wider picture
4.6.1.7.2. BUT
4.7. H12
4.7.1. Content Analysis
4.7.1.1. 1. What is content analysis?
4.7.1.1.1. "approach to the analysis of documents and texts that seeks to quantify content in tems of predetermined categories in a systematic and replicable manner."
4.7.1.1.2. Counting of certain words, people, themes
4.7.1.1.3. Different from Qualitative content analysis !! (chapter 21)
4.7.1.1.4. Also approach to analysis of documents and texts, but:
4.7.1.1.5. SYSTEMATIC AND RELIABLE
4.7.1.1.6. Quantifies content by means of PREDETERMINED CATEGORIES
4.7.1.1.7. FOCUS ON MANIFEST CONTENT
4.7.1.2. 2. Type of sampling
4.7.1.2.1. MEDIA:
4.7.1.2.2. DATES:
4.7.1.3. 3. What to count?
4.7.1.3.1. 1. SIGNIFICANT PERSONS/actors
4.7.1.3.2. 2. WORDS
4.7.1.3.3. 3. SUBJECTS & THEMES
4.7.1.3.4. 4. DISPOSITIONS
4.7.1.4. 4. Coding: schedule/manual
4.7.1.4.1. see sheet or page 283
4.7.1.4.2. Coding schedule: a form onto which all the data relating to an item being coded will be entered.
4.7.1.4.3. Coding manual: statement of instructions to coders and lists all the dimensions
4.7.1.4.4. Coding scheme requires:
4.7.1.5. 5. Advantages vs Disadv of content analysis
4.7.1.5.1. Advantages
4.7.1.5.2. Disadvantages
4.8. H13
4.8.1. Secondary Analysis & Official Statistics
4.8.1.1. 1. What is secondary analysis?
4.8.1.1.1. Analysis of data that were collected by others for different purposes = secondary - Other researchers - Institutions of the state / business organizations Primary data = collected by oneself Blurred boundary between primary & secondary data
4.8.1.2. 2. Benefits of secondary analysis
4.8.1.2.1. 1. SAVES COST & TIME, DATA IS ALREADY COLLECTED
4.8.1.2.2. 2. HIGH QUALITY DATA
4.8.1.2.3. 3. OPPORTUNITY FOR LONGITUDINAL ANALYSIS
4.8.1.2.4. 4. SUBGROUP ANALYSIS
4.8.1.2.5. 5. OPPORTUNITY FOR CROSS-CULTURAL ANALYSIS
4.8.1.2.6. 6. MORE TIME FOR DATA ANALYSIS
4.8.1.2.7. 7. REANALYSIS MAY OFFER NEW INSIGHTS
4.8.1.3. 3. Disadvantages of secondary data
4.8.1.3.1. 1. LACK OF FAMILIARITY WITH DATA
4.8.1.3.2. 2. COMPLEXITY OF DATA
4.8.1.3.3. 3. NO CONTROL OVER DATA QUALITY
4.8.1.3.4. 4. ABSENCE OF KEY VARIABLES
4.8.1.4. 4. Official statistics
4.8.1.4.1. COLLECTED BY STATE AGENCIES
4.8.1.4.2. ADVANTAGES COMPARED TO DATA FROM SURVEYS:
4.8.1.4.3. DISADVANTAGES OF OFFICIAL STATISTICS:
4.8.1.5. 5. The social construction of crime statistics
4.8.1.5.1. CRIME RATE = OFFENCES RECORDED BY POLICE
4.8.1.5.2. Contingent on social processes of decision-making
4.8.1.5.3. 8 STAGES OF (DE) SELECTION: see sheet
4.8.1.6. 6. Reliability & validity of official statistics
4.8.1.6.1. RELIABILITY - DANGER
4.8.1.6.2. VALIDITY - DANGER
5. Mixed Methods
5.1. H24 & H25
5.1.1. Beyond the Quantitative/Qualitative Divide -Mixed Methods
5.1.1.1. 1. Divide clear cut?
5.1.1.1.1. In principal:
5.1.1.1.2. FROM STRICT EPISTEMOLOGICAL/ONTOLOGICAL STANCE:
5.1.1.1.3. FROM TECHNICAL STANCE:
5.1.1.1.4. WHAT IS MIXED METHODS RESEARCH?
5.1.1.2. 2. Four dimensions considered
5.1.1.2.1. Contrast overrated:
5.1.1.2.2. 1. BEHAVIOUR VS. MEANING
5.1.1.2.3. 2. THEORY TESTING VS. PRODUCTION
5.1.1.2.4. 3. NUMBERS VS. WORDS
5.1.1.2.5. 4. ARTIFICIAL VS. NATURAL
5.1.1.3. 3. Research each other?
5.1.1.3.1. Each strategy can be used to analyze the other
5.1.1.3.2. A. QUALITATIVE APPROACH TO QUANTITATIVE RESEARCH
5.1.1.3.3. B. QUANTITATIVE APPROACH TO QUALITATIVE RESEARCH
5.1.1.4. 4. Arguments for mixed methods research
5.1.1.4.1. 1. TRIANGULATION
5.1.1.4.2. 2. COMPLEMENTARITY
5.1.1.4.3. 3. FACILITATION
5.1.1.5. 5. Benefits of mixed methods research
5.1.1.5.1. 1. Address different research sub-questions
5.1.1.5.2. 2. Instrumental development
5.1.1.5.3. 3. Increases credibility
5.1.1.5.4. 4. Different audiences
5.1.1.5.5. 5. Confirm & discover
5.1.1.5.6. But!:
6. Ethiek
6.1. H5
6.1.1. Ethics & Politics in Social Research
6.1.1.1. 1. Introduction
6.1.1.1.1. ETHIC ISSUES ARISES IN VARIOUS STAGES OF SOCIAL RESEARCH
6.1.1.1.2. PARTICULARLY IN RESEARCH METHODS SUCH AS COVERT OBSERVATION, EXPERIMENT, ETC.
6.1.1.1.3. NOT ONLY IN EXTREME CASES
6.1.1.1.4. FOUR ETHICAL STANCES:
6.1.1.2. 2. Ethical principles
6.1.1.2.1. 1. NO HARM TO PARTICIPANTS
6.1.1.2.2. 2. INFORMED CONSENT
6.1.1.2.3. 3. INVASION OF PRIVACY
6.1.1.2.4. 4. DECEPTION
6.1.1.3. 3. The difficulties of ethical decision-making
6.1.1.3.1. BLURRED BOUNDARY BETWEEN ETHICAL/UNETHICAL PRACTICES
6.1.1.3.2. COMMON PRACTICES:
6.1.1.3.3. INTERNET-BASED RESEARCH PROVIDES NEW ETHICAL DILEMMAS
6.1.1.4. 4. Politics in social research
6.1.1.4.1. VALUES INFLUENCES EVERY STAGE OF RESEARCH PROCESS
6.1.1.4.2. CANNOT CONDUCT SOCIAL RESEARCH IN A MORAL VACUUM ( Impossibility of objective, value-free research)
6.1.1.4.3. SOCIAL RESEARCHERS OFTEN HAVE TO ‘TAKE SIDES’
6.1.1.4.4. FUNDING AGENCIES HAVE AN IMPACT:
6.1.1.4.5. GATEKEEPERS
6.1.1.4.6. CONFLICTING VALUES WITHIN THE RESEARCH TEAM
6.1.1.4.7. ATTEMPTS TO THWART PUBLICATION & DISSEMINATION OF CONTROVERSIAL FINDINGS
6.1.1.4.8. USE OF FINDINGS TO FUEL POLITICAL DEBATES
7. 1e helft H14 /H1 Field
7.1. statistiek
7.1.1. Twee soorten data-analyse
7.1.1.1. Kwalitatieve Methoden: Theorieën toetsen/ generen door middel van rijke data zoals taal
7.1.1.2. Kwantitatieve Methoden: Theorieën toetsen door middel van cijfers
7.1.2. het onderzoeksproces, zie sheets
7.1.3. Variabelen
7.1.3.1. Onafhankelijke Variabele
7.1.3.1.1. - De vermoedelijke oorzaak - Een ‘predictorvariabele’ - Een gemanipuleerde variabele (in experimenten)
7.1.3.2. Afhankelijke Variabele
7.1.3.2.1. - Het vermoedelijke gevolg - Een ‘uitkomstvariabele’ - Gemeten, niet gemanipuleerd (in experimenten)
7.1.4. Meetniveaus
7.1.4.1. categorisch
7.1.4.1.1. >> Dingen worden verdeeld in aparte categorieen:
7.1.4.1.2. Binaire variabele: Er zijn maar twee categorieen
7.1.4.1.3. Nominale variabele: Er zijn meer dan twee categorieen
7.1.4.1.4. Ordinale variabele: Zelfde als nominaal, en de categorieen hebben een logische volgorde (bv opleidingsniveau)
7.1.4.2. continu
7.1.4.2.1. >> Dingen hebben een precieze score:
7.1.4.2.2. Intervalvariabele: Gelijke afstanden vertegenwoordigen gelijke verschillen van het gemeten kenmerk
7.1.4.2.3. Ratiovariabele: Zelfde als interval, maar ook de verhoudingen zijn betekenisvol (bv leeftijd, lengte)(heeft absoluut nulpunt)
7.1.5. Meetfouten (‘measurement error’)
7.1.5.1. Het verschil tussen de werkelijke waarde die we proberen te meten, en het getal dat we gebruiken om die waarde te representeren.
7.1.5.2. Validiteit: of een instrument wel meet wat het beoogt te meten.
7.1.5.3. Betrouwbaarheid: of een instrument dezelfde resultaten oplevert onder dezelfde condities.
7.1.5.4. > Betrouwbaarheid is een voorwaarde voor validiteit!
7.1.6. Hoe meten we?
7.1.6.1. Correlationeel onderzoek:
7.1.6.1.1. Observeer wat natuurlijkerwijs in de wereld gebeurt (natuurlijke samenhang), zonder direct in te grijpen.
7.1.6.1.2. Let op voor de invloed van extra (‘confounding’) variabelen.
7.1.6.2. Experimenteel onderzoek:
7.1.6.2.1. Een of meer variabelen wordt systematisch gemanipuleerd om het effect ervan te zien oop een uitkomstvariabele.
7.1.6.2.2. uitspraken doen over oorzaak en gevolg.
7.1.6.3. Methoden van Dataverzameling bij een Experiment
7.1.6.3.1. ‘Between-group’/ ‘Between-subject’/ onafhankelijk
7.1.6.3.2. ‘Within-subject’/ herhaalde-metingen
7.1.7. Typen van Variatie
7.1.7.1. Systematische Variatie
7.1.7.1.1. Verschillen in prestatie gecreeerd door een specifieke experimentele manipulatie.
7.1.7.2. Onsystematische Variatie (‘error’)
7.1.7.2.1. Verschillen in prestatie gecreeerd door onbekende factoren. (Leeftijd, geslacht, IQ, tijdstip, motivatie, meetfouten, etc.)
7.1.7.2.2. >> Randomisering: Minimaliseert onsystematische variatie.
7.1.8. Data analyseren: Frequentieverdeling (oftewel: Histogram)
7.1.8.1. Een grafiek waarin de waarden van de observaties op de horizontale as staan, met een staaf die toont hoe vaak elke waarde voorkomt in de dataset
7.1.8.2. Scheefheid (‘skewness’): De symmetrie van de verdeling
7.1.8.3. Gepiektheid (‘kurtosis’): De ‘dikte’ van de staarten van de verdeling
7.1.8.4. zie sheets
7.1.8.5. Centrummaat 1: Modus
7.1.8.5.1. Modus: De meest voorkomende score
7.1.8.5.2. Bimodaal: Heeft twee modes
7.1.8.5.3. Multimodaal: Heeft meerdere modes
7.1.8.6. Centrummaat 2: Mediaan
7.1.8.6.1. De middelste score wanneer de scores gerangordend zijn.
7.1.8.7. Centrummaat 3: Gemiddelde
7.1.8.7.1. De som van de scores gedeelde door het aantal scores.
7.1.8.8. Spreidingsmaten:
7.1.8.8.1. ‘Range’
7.1.8.8.2. Interkwartiel Range
7.1.8.8.3. Standaarddeviatie
7.1.8.9. Een stapje verder dan werkelijke data:
7.1.8.9.1. kansen
7.1.8.9.2. Standaardnormaalverdeling
7.1.8.9.3. Z-scores
7.1.9. hypothesen
7.1.9.1. Nul-hypothese, H0
7.1.9.1.1. Er is geen effect. Bijv. In een beker coca-cola blijven evenveel spermacellen in leven als in een beker water
7.1.9.2. De alternatieve hypothese, H1
7.1.9.2.1. - Ook wel de experimentele hypothese genoemd - Bijv. In een beker coca-cola blijven minder spermacellen in leven als in een beker water - De alternatieve hypothese kan een- of tweezijdig zijn