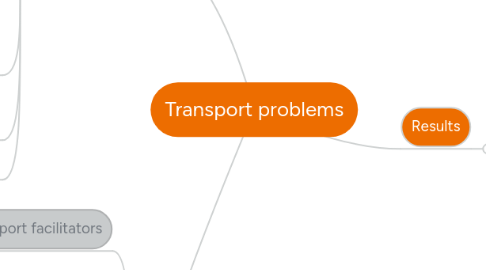
1. Solutions
1.1. Public transport facilitators
1.1.1. Increase the supply of public transport services
1.1.1.1. Mass transit system
1.1.1.1.1. Expand traffic network and link up suburbs and newtowns with main urban areas
1.1.1.1.2. Increase frequency
1.1.1.2. Other public transports
1.1.1.2.1. Increase frequency to higher accessibility and to encourage use of it
1.2. Government
1.2.1. Promote the use of public transport
1.2.1.1. Reduce traffic burdens on the roads --> supress the demands created by heavy traffic
1.2.1.2. Manage/reduce the demand
1.2.1.2.1. Discourage the use of private cars
1.2.1.2.2. Imposing high licence fees and fuel taxes
1.2.2. Urban Planning + Improve infrastructure
1.2.2.1. Link more roads to ease traffic congestion
1.2.2.2. Create new routes
1.2.2.3. Increase capacity at bottlenecks area
1.2.2.4. widen lanes and tunnels
1.2.3. Statutory measures
1.2.3.1. Euro V standards issued to cars to ease air pollution
1.2.3.2. Motor Vehicle Idling Fixed Penalty Ordinance
1.2.3.3. Environmental Protection Department subsidizing public transport providers to change their modals --> to tackle air pollution
1.2.3.4. Release of "A Clean Air Plan for Hong Kong" by the Environment Bureau
1.2.3.5. Air Quality Health Index (AQHI) implemented by Environmental Protection Department to raise public awareness of health risked related to air pollution and to take initiative tackling the issue
2. Causes
2.1. Suburbanization
2.1.1. Many people still work in the main urban areas --> they have to commute to their workplaces every day
2.1.2. High population density and active economic activity in urban areas --> high traffic demands
2.2. Lack urban planning in the past
2.2.1. Densely built residential buildings in old urban areas
2.2.1.1. Many roads are narrow
2.2.1.2. Traffic congestion is common
2.3. Better economic development and higher income level of Hong Kong people
2.3.1. Better living standards --> Increased people's private car ownership
2.3.1.1. Statistics from the Transport Department: it has increased by 12.9% throughout 2011-2015
2.4. Lack of flat land in Hong Kong
2.4.1. due to the hilly landscape
2.4.2. Average car density (cars / km of roads) Tokyo: 193 Singapore: 236 London: 166 Hong Kong: 277
2.5. Uneven population distribution in Hong Kong
2.5.1. Mostly crowded in old urban areas (e.g.: Kwun Tong, Sham Shui Po)
2.6. Bottlenecks road structure (e.g. opening of Cross Harbour tunnel)
2.6.1. Serious traffic congestion at bottleneck areas during rush hours
2.7. Similar working hours in the urban areas
2.7.1. Concentrated and heavy traffic during rush hours when people go to or leave work
3. Results
3.1. Traffic congestion
3.1.1. Air pollution
3.1.2. Business people getting to work later --> decreased and slowered productivity
3.1.2.1. reduces regional economic health
3.1.3. road rage
3.1.3.1. noise pollution
3.1.4. higher chances of collision
3.1.4.1. threaten safety or drivers and pedestrians
3.2. Overcrowding in public transport facilities
3.2.1. threatens road safety
3.3. Lack of parking spaces
3.3.1. increase in illegal parking
3.3.2. impairs local circulation
3.3.3. Further add to air pollution and traffic congestion
3.4. Air pollution
3.4.1. Affect people's health quality
3.4.1.1. slowerred work productivity
3.4.1.2. increased government expenditure on health and medical services
3.4.2. Higher risk of fire in old urban areas
3.4.3. Causes
3.4.3.1. Use of non-renewable fuels in vehicles
3.4.3.2. Greenhouse gases emitted by the heavy traffic
