Science
by Miles Ivy
1. Quantitative
1.1. On a data table if the independent variable (the one that is getting changed) is #'s then it's a line graph.
2. Qualitative
2.1. On the data table if your independent variable ( the one that is getting changed) are words then you are going to make a line graph
3. Field Trip
3.1. The water cycle is a pattern that has been going on since the beginning of time.
3.1.1. People pollute waters like lakes, ponds, rivers, etc...
3.1.2. if a farmer has his crops planted down in the rainy season and the rain washes them out the dirt goes into nearby rivers.
4. Water
4.1. We need to find a water source or we are all going to die basically.
4.2. We need to find a way to save water before we all die because if we run out of water then we will have to go to war over water.
5. How to save water for future generations.
5.1. There is only two ways we can save our water: Filter process( our own idea) and Desilanation
6. Filter Process
7. Climate Change big project
7.1. The major causes of pollution is what we did. How we thought we could solve it was Carpooling and tearing down industry
8. Climate change big project: Car Pollution
8.1. Our first problem was pollution and in china. Their industry is the most horrible pollution plantation spot i have ever seen. We thought that we can solve this problem by just having people get tax credit every time they carpool.
9. Climate change Big Project: Industry pollution
9.1. In china the industries there is what most of their pollution comes from. Our solution just tearing down the industries. we think that it could reduce the amount
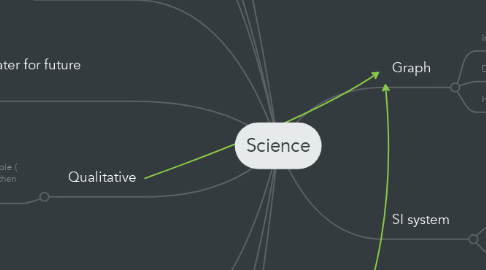
10. Graph
10.1. Independent variable is on the bottom
10.2. Dependent Variable is on the top.
10.3. Have to put a title on the graph
11. SI system
11.1. It's actually called the metric system but SI system is just another name for it.
11.2. It consists of inches
