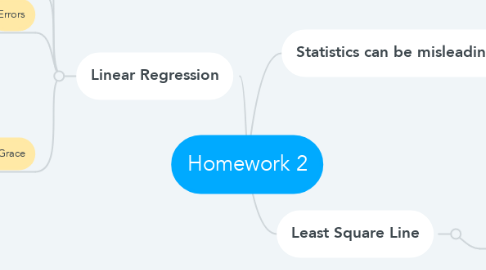
Homework 2
by Alexa Astorga


1. Linear Regression
1.1. If the x axis and the y axis move towards the positive side, there is a positive relationship
1.2. If the x axis increases and the y axis decreases, there is a negative relationship
1.3. Errors
1.3.1. Minimize the errors, make them as small as possible
1.4. Estimated Grace
1.4.1. Positive Relationship: y= b0 + b1x, b0 is the y axis, b1 is the slope, x independent variable and y is the dependent variable
1.4.2. Negative Relationship: y= b0 - b1x, b0 is the y axis, b1 is the slope, x is the independent variable and y is the dependent variable
1.4.3. Dependent Variable:
1.4.3.1. Outcome
1.4.4. Independent Variable
1.4.4.1. What we change, manipulate, control
2. Statistics can be misleading
2.1. Conditional Variable / Lurking Variable
2.1.1. A hidden, additional factor that significantly influences results
2.2. Simpson´s Paradox
2.2.1. Where the same set of data can appear to show opposite trends, depending on how it`s group

