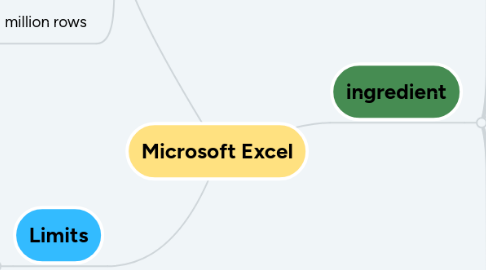
Microsoft Excel
by Panita Wongsaming


1. benefit
1.1. Create summary reports in various views, such as sales summary tables. Product summary table, summary of production plan, summary of information, lack of staff line, etc.
1.2. Create graphs of various types of information. Whether it's a bar graph, a pie chart, 2D and 3D dots, there are many variations.
1.3. Create a document that needs to be computed. Link Formula
1.4. Create a worksheet Beautiful table In various ways
1.5. Initial data storage of up to 1 million rows
2. Limits
2.1. 1,048,576 rows by 16,384 columns
2.2. Number of Sheets in Workbook = Unlimited
2.3. The list will be in the dropdown = 10,000.
2.4. Stacking function = 64
2.5. Maximum Variable Function = 255 Variable
2.6. Number of people open simultaneously = 256
2.7. Steps of Undo = 100 steps
2.8. Number of columns in Pivot = 16,384
2.9. จำนวน แถว ใน Pivot = 1,048,576
3. ingredient
3.1. Title Bar
3.1.1. This is the section that shows the program name. And the list of files has been enabled.
3.2. Quick Access
3.2.1. It is used to display frequently used commands.
3.3. File
3.3.1. It is used to store commands in the program.
3.4. Ribbon
3.4.1. This is a list of commands.
3.5. Status Bar
3.5.1. Part of the page. And the number of characters used in the document.
3.6. Name Box
3.6.1. This is the channel used to display the name of the active at that time.
3.7. Formula Bar
3.7.1. It is used to display the use of various calculation formulas.
3.8. Cell
3.8.1. The table field is used to store the data, each cell box is named after the row. And columns showing the position of the cell.
3.9. Column
3.9.1. Is a vertical cell of the worksheet (Worksheet)
3.10. Row
3.10.1. A horizontal cell slice of the worksheet.
3.11. Sheet Tab
3.11.1. A bar that shows the number of sheets opened.
