

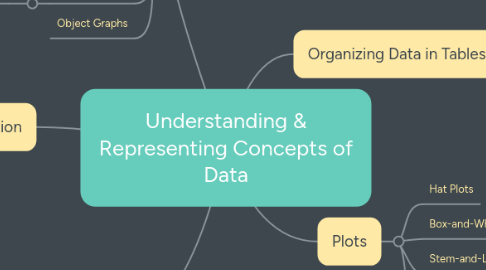
Understanding & Representing Concepts of Data
by Melissa Landess
1. Data Collection
1.1. Recording
1.2. Organizing
2. Organizing Data in Tables
2.1. Interpret Data
2.2. Comparing Data
2.2.1. Stacked Bar Graphs
2.2.2. Double Bar Graphs
3. Graphs
3.1. Circle Graphs
3.2. Line Graphs
3.3. Bar graphs
3.3.1. Histograms
3.3.2. Stacked Bar Graphs
3.3.3. Double Bar Graphs
3.4. Picture Graphs
3.4.1. Scaled Picture Graphs
3.5. Object Graphs
4. Plots
4.1. Hat Plots
4.2. Box-and-Whisker Plots
4.3. Stem-and-Leaf Plots
4.4. Line Plots
5. Statistics
5.1. Mode
5.2. Range
5.3. Outlier
5.4. Median
5.5. Mean
5.5.1. Mean Absolute Deviation
5.5.2. Mean Average