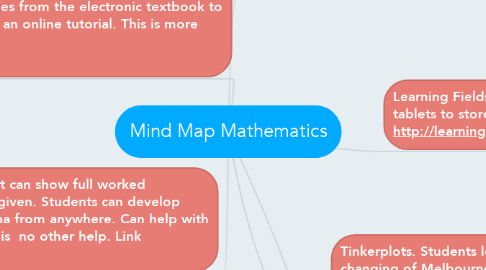
1. eWorked Examples/Online Tutorials. This can be used to complement my teaching when there is a lot of data to consider in statistics. I explain eWorked Examples from the electronic textbook to give students a deeper understand. This can be combined with an online tutorial. This is more efficient when there are graphs and data sets to explain. Link https://www.youtube.com/results?q=maths+tutorials
1.1. SAMR- Augmentation
1.2. Mindtools- Knowledge construction, learning with technology.
2. Geogebra. Students use this to enhance their understanding of quadratic functions. Points on a graph are given to them and they must find as many equations as possible that go through those points. This is a computer exercise. Equations can also be found through trial and error by changing parameters. Link http://www.geogebra.org/cms/en/
2.1. SAMR-Modification
2.2. Mindtools- Knowledge construction, Learning with technology, developing autonomy and confidence
3. Wolfram Alpha. This is a website and application that can show full worked mathematical examples and graphs of any question given. Students can develop autonomy from this as they can access Wolfram Alpha from anywhere. Can help with homework difficulties and help students when there is no other help. Link http://www.wolframalpha.com/
3.1. SAMR- Augmentation
3.2. Mindtools- Knowledge construction, learning with technology, developing autonomy and confidence, cost and effort beneficial,
4. Mathletics. Students use the online maths gaming system Mathletics to revise topics and test themselves to achieve the games goals. Help for each question is provided as a hint and the answers of questions are given with full working. Link http://www.mathletics.com.au/
4.1. SAMR- Augmentation
4.2. Mindtools- Knowledge Construction, learning with technology, cost and effort beneficial, developing autonomy and confidence.
5. Tinkerplots. Students look at data from the Bureau of Meteorology. They describe the changing of Melbourne's average temperature over time. Students are free to represent data in new ways. Tinkerplots also has the capability to easily compare data sets and manipulate and represent them like never before. Link http://www.keycurriculum.com/products/tinkerplots
5.1. SAMR- Redefinition
5.2. Mindtools- Learners as designers, knowledge construction, learning with technology, cost and effort beneficial, developing autonomy and confidence.
6. Learning Fields. The application for the iPad and other tablets to store and use digital textbooks. Link http://learningfield.com.au/
6.1. SAMR- Substitution
6.2. Mindtools- knowledge construction, learning with technology, cost and effort beneficial.