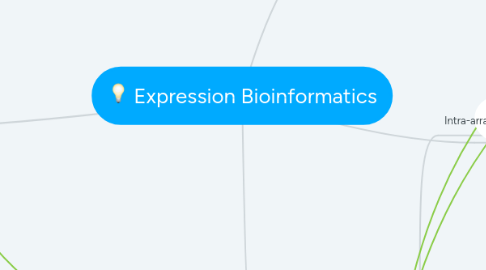
1. 4. Raw Expression Data
1.1. Raw Data
1.1.1. Image
1.1.2. Reads
1.2. Spot finding
1.2.1. spotted circle
1.2.2. in situ squares
1.3. Segmentation
1.3.1. foreground
1.3.2. background
1.4. Quantification
1.4.1. foreground intensity
1.4.2. background intensity
1.5. Quality assessment
1.5.1. Uniformity
1.5.2. Spots
1.5.3. Array wide
1.5.4. Histograms
1.6. RNA Seq
1.6.1. Reads
2. 2. Descriptive Statistics
2.1. Histograms
2.2. QQ-plots
2.3. pdf / cdf
2.4. MA-plot
2.5. Boxplots
2.6. estimator of location
2.6.1. Quantiles
2.6.2. Mean
2.6.3. Median
2.6.4. Tukey's Biweight
2.7. Estimator Deviation
2.7.1. Variance
2.7.2. MAD
2.8. Scatter Plots
3. 5. Normalization
3.1. Intra-array (MAS5)
3.1.1. Trimmed Mean
3.1.2. Tukeys Biweight
3.2. Inter-array
3.2.1. 2 arrays
3.2.1.1. Linear Regression
3.2.1.1.1. y = ax + b
3.2.1.1.2. Least Squares Error
3.2.1.2. Invariant probe regression
3.2.1.2.1. Invariant Sets
3.2.1.2.2. Invariant difference selection algorithm
3.2.1.2.3. Rank vectors
3.2.1.2.4. Order preserving
3.2.2. >= 2 arrays
3.2.2.1. multiple linear regression
3.2.2.2. Non-linear (Lowess) regression
3.2.2.2.1. Piecewise linear regression functions
3.2.2.3. Distribution (Quantile) normalization
3.2.2.3.1. QQ plots
3.2.2.3.2. Permutations
3.2.2.4. global scaling, centering
3.2.2.4.1. means
3.3. RNA-seq normalization
3.3.1. gene bias
3.3.1.1. relative length
3.3.1.1.1. rpk(G)
3.3.2. sample bias
3.3.3. technical bias
4. 1. Transcriptome Technologies
4.1. Microarray
4.1.1. Dual Dye experiment
4.1.2. Single dye experiment
4.1.3. Raw Data: monochrome image
4.2. RNA-Seq (NGS)
4.2.1. Raw Data: Reads

