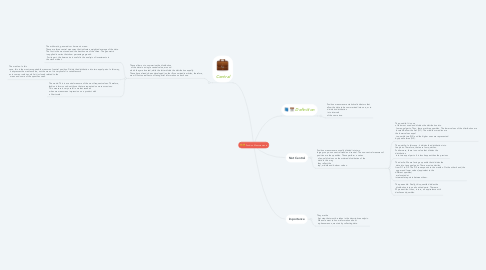
1. Central
1.1. These allow us to summarize the distribution of the data in a single central value, around which they are located; while the latter divide the distribution equally. These have already been developed in other Economipedia articles, therefore, we will limit ourselves to offering brief information on each one.
1.1.1. The arithmetic, geometric or harmonic mean: These are three central measures that indicate a weighted average of the data. The first is the most used and the best known of the three. The geometric is applied in series that show percentage growth. For its part, the harmonica is useful in the analysis of investments in the stock market.
1.1.2. The median: In this case, this is the most recognizable measure of central position. Divide the distribution into two equal parts. In this way, it expresses the median value, not the mean. It is very useful in variables such as income or salaries, while it is closely related to the mean and some of the quantiles seen.
1.1.3. The mode: This is a central measure of the most frequent values. Therefore, fashion informs us about those that are repeated on more occasions. This measure is very useful in market research when we measure an impression on a product with a likert scale.
2. Definition
2.1. Position measures are statistical indicators that allow the data to be summarized into one, or to divide its distribution into intervals of the same size.
3. Not Central
3.1. Position measures are usually divided into two large groups: non-central trend and central. The non-central measures of position are the quantiles. These perform a series of equal divisions on the ordered distribution of the data. In this way, they reflect the top, middle and bottom values.
3.1.1. The quartile: It is one of the most used and divides the distribution into four equal parts. Thus, there are three quartiles. The lower values of the distribution are located Bellow the first (Q1). The middle or median are the lower values equal to quartile two (Q2) and the higher ones are represented by quartile three (Q3).
3.1.2. The quintile: In this case, it divides the distribution into five parts. Therefore, there are four quintiles. Furthermore, there is no value that divides the distribution into two equal parts. It is less frequent than the previous
3.1.3. The decile: We are facing a quantile that divides the data into ten equal parts. There are nine deciles, from D1 to D9. The D5 corresponds to the median. On the other hand, the upper and lower values (equivalent to the different quartiles) are located at intermediate points between them.
3.1.4. The percentile: Finally, this quantile divides the distribution into one hundred parts. There are 99 percentiles. It has, in turn, an equivalence with deciles and quartiles.
