
1. With greater fertility
1.1. Morona Santiago 5.5 children per woman
1.2. Orellana 4.7
1.3. Imbabura 4.4
1.4. Napo 4.3
1.5. Zamora Chinchipe 3.9
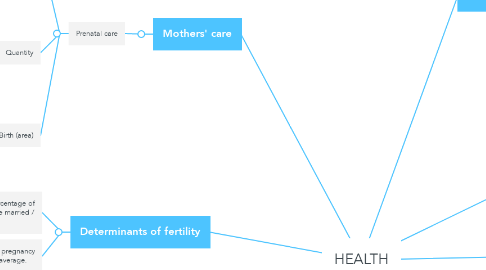
2. Determinants of fertility
2.1. From 1994 to 2012 the percentage of women of childbearing age married / united, decreases.
2.2. The period not susceptible to pregnancy will be located in 8.5 months average.
3. Mothers' care
3.1. Prenatal care
3.1.1. Areas
3.1.1.1. Urban
3.1.1.1.1. 96.9% have received at least one prenatal control
3.1.1.1.2. 81.4% have received the first control during the first trimester
3.1.1.2. Rural
3.1.1.2.1. 90.7% have received at least one prenatal control
3.1.1.2.2. 73.7% have received the first control during the first timester
3.1.2. Quantity
3.1.2.1. There is an increase in the first prenatal control. From 64.6% (2007) to 79% (2012)
3.1.3. Cesarean Birth (area)
3.1.3.1. Urban
3.1.3.1.1. 1994-2004: 34.0%
3.1.3.1.2. 2007-2012: 44.8%
3.1.3.2. Rural
3.1.3.2.1. 1994-2004: 16.1%
3.1.3.2.2. 2007-2012: 31.5%
4. Fertility
4.1. The fertility rate has been reduced from 5.4 to 3 children per woman.
4.2. Evolution of the total fertility rate
4.3. Fertility rate by province
4.3.1. With less fertility
4.3.1.1. Tungurahua 2.7 children per woman
4.3.1.2. El Oro 2.6
4.3.1.3. Galápagos 2.6
4.3.1.4. Chimborazo 2.7
4.3.1.5. Cotopaxi 2.7
4.3.2. Increase in adolescent fertility (15 to 19 years).
4.4. Fertility structure by age
4.4.1. Ecuador maintains an early cusp of fertility between 20 and 24 years.
5. CHILD CARE
5.1. Infant mortality
5.1.1. Less than 1 year old 13 deaths every 1000 births
5.1.2. Less than 5 years old 16 deaths every 1000 births
6. Sexual
6.1. major sexual activity
6.1.1. premarital
6.1.1.1. 6 of 10 women
6.1.1.2. men from 15 to 24 years
6.1.1.3. 64.6% where to do it and took it for themselves
6.1.2. general
6.1.2.1. increased 12.6% between 2004 and 2012
6.2. diseases
6.2.1. HIV
6.2.1.1. general knowledge 2012
6.2.1.1.1. women
6.2.1.1.2. men
6.2.1.1.3. superficial knowledge: 10.4%
6.2.1.2. increase from 2004 to 2012 about HIV: 3.8%
6.2.1.2.1. increased 17.4% between 2004 and 2012
6.2.1.2.2. about the test: 10.4%
6.2.1.2.3. where to take it: 33.8%
7. Health Services
7.1. Social Security affiliates
7.1.1. 2004: 19,2%
7.1.2. 2012: 37%
8. Family Planification
8.1. Contraceptive Methods
8.1.1. More People are using them
8.1.1.1. 80.1% of sexually active women are using protection (2012).
8.1.1.2. In 1979 only 33.6% of women used protection.
8.1.2. Main Contraceptive methods used by Ecuadorian women
8.1.2.1. Esterilization 32.3%
8.1.2.2. Pills 11.2%
8.1.2.3. Injections 10.8%
8.1.3. Percentage women vs. men using protection
8.1.3.1. Married
8.1.3.1.1. Men: 70%
8.1.3.1.2. Women: 80.1%
8.1.3.2. Not married
8.1.3.2.1. Men: 64.8%
8.1.3.2.2. Women: 70.6%