
1. Return/ Recycle
1.1. E-waste Recycling Facility
2. Manufacturing
2.1. China
3. Processed Materials
3.1. Anode (Negative Electrode)
3.1.1. Graphite (Processed)
3.1.2. Lithium Titanate
3.1.2.1. Toshiba
3.1.2.2. Altairnano
3.1.3. Hard Carbon
3.1.3.1. Energ2
3.1.4. Tin/Cobalt Alloy
3.1.4.1. Sony
3.1.5. Silicon/Carbon
3.1.5.1. Amprius
3.2. Separators
3.3. Cathode (Positive Electrode)
3.3.1. Lithium Nickel Manganese Cobalt Oxide
3.3.1.1. Imara Corporation
3.3.1.2. Nissan Motor
3.3.1.3. Microvast Inc.
3.3.2. Lithium Manganese Oxide
3.3.2.1. LG Chem
3.3.2.2. NEC
3.3.2.3. Samsung
3.3.2.4. Hitachi
3.3.2.5. Nissan/AESC
3.3.2.6. EnerDel
3.3.3. Lithium Iron Phosphate
3.3.3.1. University of Texas/Hydro-Québec
3.3.3.2. Phostech Lithium Inc.
3.3.3.3. Valence Technology
3.3.3.4. A123Systems/MIT
3.4. Lithium
3.4.1. Australia (41.2%)
3.4.2. Chile (36%)
3.4.3. Argentina (11.7%)
3.4.4. China (6.7%)
3.4.5. Zimbabwe (2.7%)
3.4.6. Canada (1.4%)
3.4.7. Portugal (0.9%)
3.4.8. Brazil (0.5%)
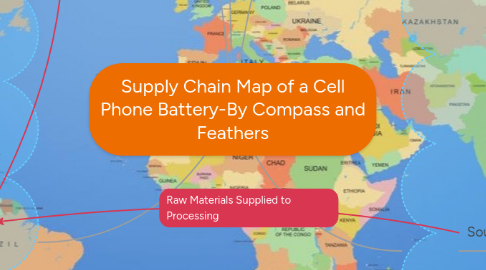
4. Sourcing Raw materials
4.1. Cobalt, Nickel, & Copper
4.1.1. Mining Locations
4.1.1.1. Democratic Republic of the Congo
4.1.1.1.1. 56,000 MT
4.1.1.2. Zambia
4.1.1.2.1. 13,000 MT
4.1.1.3. China
4.1.1.3.1. 7,200 MT
4.1.1.4. Canada
4.1.1.4.1. 7,000 MT
4.1.1.5. Australia
4.1.1.5.1. 6,500 MT
4.1.1.6. Russia
4.1.1.6.1. 6,300 MT
4.1.1.7. Cuba
4.1.1.7.1. 4,200 MT
4.1.1.8. Philippines
4.1.1.8.1. 3,700 MT
4.1.1.9. New Caledonia
4.1.1.9.1. 3,500 MT
4.1.1.10. South Africa
4.1.1.10.1. 3,000 MT
4.1.1.11. Brazil
4.1.1.11.1. 3,000 MT
4.1.1.12. Morocco
4.1.1.12.1. 1,800 MT
4.2. Graphite (Raw)
4.2.1. Suppliers
4.2.1.1. Canada
4.2.1.1.1. Zenyatta Ventures
4.2.1.1.2. Saint Jean Carbon
4.2.1.1.3. Mason Graphite
4.2.1.1.4. Lomiko Metals Inc.
4.2.1.2. North America (Canada+USA)
4.2.1.2.1. Alabama
4.2.1.3. Australia
4.2.1.3.1. Hexagon Resources
4.2.1.3.2. Anson Resources (Mayan Iron Corp.)
4.2.1.3.3. Bora Bora Resources Ltd.
4.2.1.3.4. Talga Resources
4.2.1.4. Sweden
4.2.1.4.1. Flinders Resources
4.2.2. Mining Locations
4.2.2.1. China
4.2.2.1.1. 780,000 MT
4.2.2.2. India
4.2.2.2.1. 170,000 MT
4.2.2.3. Brazil
4.2.2.3.1. 80,000 MT
4.2.2.4. Turkey
4.2.2.4.1. 32,000 MT
4.2.2.5. Canada
4.2.2.5.1. 30,000 MT
4.2.2.6. North Korea
4.2.2.6.1. 30,000 MT
4.2.2.7. Mexico
4.2.2.7.1. 22,000 MT
4.2.2.8. Russia
4.2.2.8.1. 15,000 MT
4.2.2.9. Norway
4.2.2.9.1. 8,000 MT
4.2.2.10. Zimbabwe
4.2.2.10.1. 7,000 MT