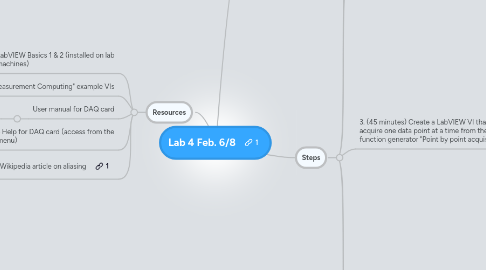
1. Resources
1.1. LabVIEW Basics 1 & 2 (installed on lab machines)
1.2. "Measurement Computing" example VIs
1.2.1. C:\Program Files\National Instruments\LabVIEW 2010\examples\Universal Library\
1.3. User manual for DAQ card
1.3.1. http://www.mccdaq.com/PDFs/Manuals/usb-1208LS.pdf
1.4. Online Help for DAQ card (access from the Start menu)
1.5. Wikipedia article on aliasing
2. Goals
2.1. Improve LabVIEW skills
2.2. Learn a bit about data acquisition (DAQ)
2.2.1. Just the basics--issues with speed, aliasing, etc.
2.3. Solidify git/github skills
3. Steps
3.1. 1. (20 minutes) Fork github project for lab 3 and clone the repository to a suitable place on your local lab machine, using your own account and gitbash.
3.1.1. https://github.com/stevekochscience/2012-Physics-308L-Lab-4
3.2. 2. (15 minutes) Use "Measurement Computing->InstaCal" to verify your board is working and figure out the board number
3.2.1. Plug in USB board, use some jumper wires, etc.
3.3. 3. (45 minutes) Create a LabVIEW VI that will acquire one data point at a time from the function generator "Point by point acquisition"
3.3.1. See "Example point by point, software timed.vi" but create your own VI from scratch
3.3.1.1. XAIN.vi from the company is another example VI
3.3.2. Use AIn.vi from the MCC Universal Library
3.3.3. Use a loop
3.3.4. Use a low frequency initially (less than 1 Hz) And make sure you have connections correct
3.3.5. Graph the output wave to a waveform graph or waveform chart (your choice, but influences programming style)
3.3.6. Questions (take notes while you explore / think)
3.3.6.1. What is the maximum frequency wave that you can reliably sample?
3.3.6.2. What limits the frequency?
3.3.6.3. (The user manual may help you understand)
3.3.6.4. Save screenshots and update your notebook as you explore these questions. You can also right-click graphs and export the data to excel, or you can save programmatically if you'd like
3.3.7. Commit your VI when things are working and when you're finished with this step (i.e. you can commit more than once).
3.3.8. Push your final items (VI, screenshots, graphs, anything else) to your forked github project
3.4. 4. (1 hour) What if you want to acquire higher frequency waves?
3.4.1. See "Example buffered read, one time.vi"
3.4.2. Recreate this VI and adjust parameters to read a 500 Hz wave (impossible w/ point by point) with a high sampling rate (how high can you go?) (needs to be much higher than 500 Hz to be able to see the wave, of course)
3.4.3. Same as above with lab notebook, screenshot, graph, etc. & committing and pushing
3.5. 5. Homework
3.5.1. Same as usual--finish notebook by Friday night, comment on others by Monday noon.
