Economic development

Economic Development Indicators- Mind map

Economic development
par Juan Ramon Eguiguren Jervis
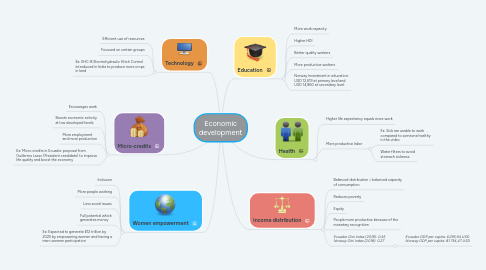
1. Technology
1.1. Efficient use of resources
1.2. Focused on certain groups
1.3. Ex: EHC-8 Electrohydraulic Hitch Control introduced in India to produce more crops in land
2. Micro-credits
2.1. Encourages work
2.2. Boosts economic activity at low developed levels
2.3. More employment and more production
2.4. Ex: Micro credits in Ecuador proposal from Guillermo Lasso (President candidate) to improve life quality and boost the economy
3. Women empowerment
3.1. Inclusion
3.2. More people working
3.3. Less social issues
3.4. Full potential which generates money
3.5. Ex: Expected to generate $12 trillion by 2025 by empowering women and having a men=women participation
4. Education
4.1. More work capacity
4.2. Higher HDI
4.3. Better quality workers
4.4. More productive workers
4.5. Norway Investment in education: USD 12,619 at primary level and USD 14,860 at secondary level
5. Health
5.1. Higher life expectancy equals more work
5.2. More productive labor
5.2.1. Ex. Sick are unable to work compared to someone healthy in the video
5.2.2. Water filters to avoid stomach sickness
6. Income distribution
6.1. Balanced distribution = balanced capacity of consumption
6.2. Reduces poverty
6.3. Equity
6.4. People more productive because of the monetary recognition
6.5. Ecuador Gini index (2018): 0.45 Norway Gini index (2018): 0.27
6.5.1. Ecuador GDP per capita: 6.295,94 USD Norway GDP per capita: 81.734,47 USD