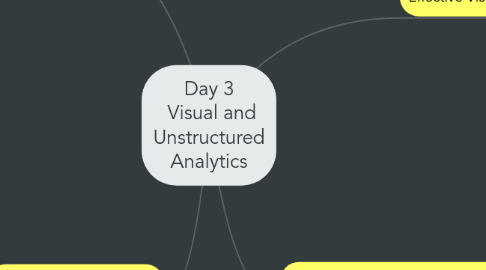
1. Qualitative Data Analysis
1.1. Legal Analytics
1.2. Visualising Unstructured
1.2.1. Word Cloud Generator
1.2.2. Phrase Net
1.2.3. Tag Cloud
1.2.4. Word Tree
1.2.5. STAG Cloud
1.3. Market Research Survey Analytics
1.4. Analytics for Unstructured Data
1.5. Related Links
1.6. Author(s)
2. Effective Visual Analytics
2.1. Mapping Visualization
2.1.1. Heat Map
2.1.2. Cluster Pin
2.1.3. Voronoi
2.2. Process Visualization
2.2.1. Information Visualization
2.2.1.1. Timeline
2.2.1.2. Cycle Diagram
2.2.1.3. Petri Net
2.2.1.4. Flow Chart
2.2.1.5. Systems Dynamic Visualisation
2.2.1.6. Data Flow Diagram
2.2.2. Concept Visualization
2.2.2.1. Soft System Modelling
2.2.2.2. Meeting Trace
2.2.2.3. Flight Plan
2.2.2.4. Communication Diagram
2.2.2.5. Swim Lane Diagram
2.2.2.6. Gantt Chart
2.2.2.7. Decision Tree
2.2.2.8. Process Event Chains
2.2.2.9. Pert Chart
2.2.2.10. Cpm Critical Path Method
2.2.3. Compound Visualization
2.2.3.1. Learning Map
2.2.4. Metaphor Visualization
2.2.4.1. Funnel
2.2.4.2. Metro Map
2.2.5. Strategy Visualization
2.2.5.1. Life Cycle Diagram
2.2.5.2. Technology Roadmap
2.2.5.3. S-cycle
2.2.5.4. Decision Discovery Diagram
2.2.5.5. Value Chain
2.2.5.6. Hype Cycle
2.3. Infographics
2.3.1. Bubble Charts
2.3.2. Mutli Layer Map
2.3.3. Rich Mind Map
2.3.4. Circos Graphs
2.3.5. Flyovers
2.3.6. Ghost Chart
2.3.7. Circle Chart
2.3.8. Traditional
2.4. Structure Visualization
2.4.1. Data Visualization
2.4.1.1. Continium
2.4.1.2. Table
2.4.1.3. Pie Chart
2.4.1.4. Bar Chart
2.4.1.5. Histogram
2.4.1.6. Tukey Box Plot
2.4.1.7. Cartesian Co-ordinates
2.4.1.8. Line Chart
2.4.1.9. Area Chart
2.4.1.10. Scatterplot
2.4.1.11. Spectogram
2.4.1.12. Sparcline
2.4.2. Information Visualization
2.4.2.1. Radar Chart Cobweb
2.4.2.2. Sankey Diagram
2.4.2.3. Parrallel Co-ordinates
2.4.2.4. Tree Map
2.4.2.5. Cone Tree
2.4.2.6. Information Lense
2.4.2.7. Hyperbolic Tree
2.4.2.8. Entity Relation Diagram
2.4.2.9. Venn Diagram
2.4.2.10. Cluster Visualization
2.4.3. Concept Visualization
2.4.3.1. Mind Map
2.4.3.2. Minto Pyramid Technique
2.4.3.3. Synergy Map
2.4.3.4. Square of Oppositions
2.4.3.5. Concentric Circles
2.4.3.6. Cause Effect Chains
2.4.3.7. Force Feild Diagram
2.4.3.8. Argument Slide
2.4.3.9. Toulmin Map
2.4.3.10. IBIS Argumentation Map
2.4.3.11. Concept Skeleton
2.4.3.12. Perspective Diagram
2.4.3.13. Concept Fan
2.4.3.14. Evocative Knowledge Map
2.4.3.15. Vee Diagram
2.4.3.16. Concept Map
2.4.3.17. Dilema Diagram
2.4.4. Compound Visualization
2.4.4.1. Graphic Visualization
2.4.4.2. Cartoon
2.4.4.3. Rich Picture
2.4.4.4. Knowledge Map
2.4.4.5. InforMural
2.4.5. Metaphor Visualization
2.4.5.1. Temple
2.4.5.2. Story Template
2.4.5.3. Tree
2.4.5.4. Bridge
2.4.5.5. Parameter Ruler
2.4.5.6. Iceberg
2.4.5.7. Heavan and Hell
2.4.6. Strategy Visualization
2.4.6.1. Supply Demand Curve
2.4.6.2. Performance Charting
2.4.6.3. Strategy Map
2.4.6.4. Organization Chart
2.4.6.5. House of Quality
2.4.6.6. Feedback Diagram
2.4.6.7. Failure Tree
2.4.6.8. Magic Quadrant
2.4.6.9. Porters Five Forces
2.4.6.10. Stakeholder Map
2.4.6.11. ishikawa Diagram
2.4.6.12. Spray Diagram
2.4.6.13. Taps
2.4.6.14. Stakeholder rating Map
2.4.6.15. Strategy Canvas
2.4.6.16. bcg Matrix
2.4.6.17. Affinity Diagram
2.4.6.18. Zwickys Morphological Box
2.4.6.19. Mintzberg's Organigraph
2.4.6.20. Strategy Game Board
2.4.6.21. Portfolio Diagram
2.4.6.22. Edgeworth Box
2.5. Network Visualization Methods
2.5.1. Semnatic Network
2.5.2. Internet Attacks
2.6. Author(s)
2.6.1. John Tukey
2.6.2. Edward Tufte
2.6.3. Turning Numbers into Knowledge, Jonathan G. Koomey, 2001
2.6.4. Tom Kawamoto and Bob Mathers KPI Factory
2.6.5. William S. Cleveland, Visualizing Data, Hobart Press, 1993
2.6.6. Now You See It: Simple Visualization Techniques for Quantitative Analysis, Stephen Few Principal, Perceptual Edge 2009
3. Social and Semantic Web Analytics
3.1. Semantic Web
3.1.1. Inference
3.1.1.1. A Semantic web program understands that you can add to the set of relationships, although it was not part of the original data.
3.1.2. Ontology
3.1.3. Query
3.1.4. Linked Data
3.2. Social Media
3.2.1. Social Media Landscape
3.2.1.1. LiveCasting Video and Audio
3.2.1.2. Wiki
3.2.1.3. Music
3.2.1.4. Events
3.2.1.5. Documents
3.2.1.6. Video Aggregation
3.2.1.7. Video
3.2.1.8. Location
3.2.1.9. Customers
3.2.1.10. Niche Networks
3.2.1.11. Social Networks
3.2.1.12. SMS / Voice
3.2.1.13. Twitter related
3.2.1.14. Lifestreams
3.2.1.15. Micromedia
3.2.1.16. Blog Communities
3.2.1.17. Blogs / Conversations
3.2.1.18. Blog Platforms
3.2.1.19. Crowd Sourced Content
3.2.1.20. Comment / Reputation
3.2.1.21. Social Bookmarks
3.2.1.22. Pictures
3.2.2. Database Landscape
3.2.2.1. New Sql
3.2.2.2. No SQL
3.2.2.3. Relational
3.2.2.4. Analytical
3.2.2.4.1. Mapr
3.2.2.4.2. Dryad
3.2.2.4.3. Piccolo
3.2.2.4.4. Brisk
3.2.2.4.5. Hadoop
3.2.3. Authors
3.2.3.1. SAS® Social Media Analytics Integrate, Analyze and Act on Online Conversations (See White paper)
4. Communicating Analytics
4.1. Audience Landscape
4.1.1. Tactical
4.1.1.1. Purpose
4.1.1.2. Users
4.1.1.3. Scope
4.1.1.4. Information
4.1.1.5. Updates
4.1.1.6. Emphasis
4.1.2. Strategic
4.1.2.1. Purpose
4.1.2.2. Users
4.1.2.3. Scope
4.1.2.4. Information
4.1.2.5. Updates
4.1.2.6. Emphasis
4.1.3. Operational
4.1.3.1. Purpose
4.1.3.2. Users
4.1.3.3. Scope
4.1.3.4. Information
4.1.3.5. Updates
4.1.3.6. Emphasis
4.2. Meaningfull Metrics
4.2.1. The same measure at the same point in time in the past
4.2.1.1. the same day last year
4.2.2. The same measure at some other point in time in the past
4.2.2.1. , the end of last year
4.2.3. Comparison to the current target for the measure
4.2.3.1. a budget for the current period
4.2.4. • Relationship to a future target for the measure
4.2.4.1. we’re at 75% of this year’s budget
4.2.5. A prior prediction of the measure
4.2.5.1. a forecast of where we expected to be today
4.2.6. Relationship to a future prediction of the measure
4.2.6.1. we’re at 90% of this quarter’s forecast
4.2.7. Some measure of the norm for this measure
4.2.7.1. monthly average or normal range
4.2.8. An extrapolation of the current measure in the form of a probable future, either at a specific point in the future or as a time series
4.2.9. Competitors’ versions of the same measure
4.2.10. A separate, but related, measure
4.2.10.1. revenue compared to profit
