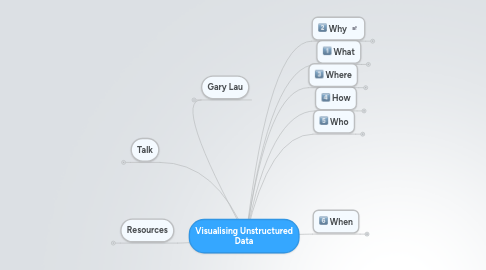
1. Gary Lau
1.1. Senior Business Analyst MQ
1.2. Analytics
1.3. 10+ years dealing with Business Questions
1.4. "Mental Models are made to be Broken"
1.5. "Bringing Meaning to Madness"
2. Talk
2.1. MQ Analytics Journey
2.2. BUZZ ME!
3. Resources
3.1. Blogs
3.1.1. Gary's Work in Process
3.1.2. Kalev
3.1.3. Data Scientist Blog
3.1.4. Guardian Data Blog
3.2. Unstructured Data
3.2.1. Semantic Web
3.2.2. Sound To Text
3.2.3. Book: Search User Interfaces
3.2.4. Quora
3.2.5. Natural Language Toolkit
3.3. Visualisation
3.3.1. GNUPlot
3.3.2. Snake Oil
3.3.3. Tools for Visualisation
3.3.4. Standford Visualisation Group
3.3.5. Standford Unversity
3.3.6. Tools for Data Visualisation
3.3.7. Touch Graph
3.3.8. Designing Data Visualizations
3.3.9. Gephi
3.3.10. R Resource
3.3.11. Flowing Data
3.3.11.1. American Spending
3.3.12. SBS ABS 2012 Census Visualisation
3.3.13. Financial Markets
3.3.14. Free Visualsiations
3.3.15. ITO
3.3.16. Jeff
4. How
4.1. "Computers can only return results, since they have lots of memory and no imagination." - Gary Lau
4.2. Computer Processing
4.2.1. Statistics - Insight Without Understanding
4.2.1.1. Word Cloud Generator
4.2.1.1.1. word frequency
4.2.1.2. Tree Cloud
4.2.1.2.1. word proximity
4.2.1.3. Word Tree
4.2.1.3.1. theme
4.2.1.4. Leximancer Portal
4.2.1.4.1. Company
4.2.1.4.2. Technology
4.2.1.4.3. Evaluation
4.2.2. NLP - Natural Language Processing
4.2.2.1. Semantics: Meaning, typically contextually dependent and hinted at by symbols
4.2.2.2. Terminology
4.2.2.2.1. Tokenization: Identification of distinct elements, e.g., words, punctuation mark
4.2.2.2.2. Stemming: Reducing word variants (conjugation, declension, case, pluralization) to bases.
4.2.2.2.3. Named entities: people, companies, places, etc.
4.2.2.2.4. Co-reference: Multiple expressions that describe the same thing.
4.2.2.2.5. Pattern-based entities: e-mail addresses, phone numbers, etc.
4.2.2.2.6. Concepts: abstractions of entities
4.2.2.2.7. Concrete and abstract attributes (e.g., 10-year, expensive, comfortable)
4.2.2.2.8. Taxonomy: An exhaustive, hierarchical categorization of entities and concepts, either specified or generated by clustering.
4.2.2.2.9. Ontology : In practice, a classification of a set of items in a way that represents knowledge.
4.2.2.2.10. Subjectivity in the forms of opinions, sentiments, and emotions: attitudinal data.
4.2.2.3. Limitations
4.2.2.3.1. Ambiguity
4.2.2.3.2. Data preparation
5. What
5.1. Unstructured Data
5.1.1. What does it look like?
5.1.1.1. Square
5.1.1.1.1. Spider web
5.1.2. Largely Synonymous with "Text Data"
5.1.2.1. Sensations
5.1.2.2. Thoughts
5.1.2.3. Feelings
5.1.2.4. Actions
5.1.2.5. Sound & Images i.e. videos
5.1.3. Key difference
5.1.3.1. Dimensionality
5.1.3.2. 80% of all data
5.1.4. Examples
5.1.4.1. Flesh Map
5.1.4.2. Visuwords
5.1.4.3. Tweeterverse
5.1.4.4. Anymails
5.2. Visualisation
5.2.1. Visual Cognitive Psychology
5.2.1.1. information overload
5.2.1.2. natural ability to group, compare, correlate, detect patterns and outliers
5.2.2. Examples
5.2.2.1. US Debt
5.2.2.1.1. Dashboard Madness
5.2.2.1.2. Visual Context
5.2.2.2. Sentiment
5.2.2.2.1. Exploration
5.2.2.2.2. Explanation and Action
5.2.2.3. Data Driven Documents
5.3. 1+1= Power to Fight Madness
5.3.1. US Supermarket Sentiment
5.3.2. combine with Datamining is 1+1+1
6. Who
6.1. "Text analytics-based searches for information provide non-definitive results. I don't know what to do" - Boss?
6.2. Decison makers
6.2.1. Internal
6.2.1.1. Existing Students
6.2.1.2. Existing Staff
6.2.1.2.1. Research
6.2.2. External
6.2.2.1. Prospective Students
6.2.2.2. Alumni
6.3. Data Scientists
6.3.1. Qualities
6.3.1.1. no substitute for verbal communication and good old-fashioned face time
6.3.1.2. training to reduce "alienation"
6.3.2. Environment
6.3.2.1. culture that both thrives and acts on customer feedback
6.4. Vendors
6.4.1. Evaluate
6.4.1.1. Support and Training
6.4.1.2. Level of accuarcy
6.4.1.3. Integration into BI Reporting
6.4.1.4. Integration into Data Mining
6.4.1.5. Ingestion Capability
6.4.1.6. Language Support
6.4.1.7. Visualisation
6.4.2. Market
6.4.2.1. Academia
6.4.2.1.1. Leximancer
6.4.2.1.2. NVIVO
6.4.2.1.3. Rapid Miner
6.4.2.2. Industrial
6.4.2.2.1. SAS Enterprise Miner
6.4.2.2.2. Attivio
6.4.2.2.3. IBM Content Analytics
6.4.2.2.4. IBM Modeller
6.4.2.2.5. Oracle Endeca Information Discovery
6.4.2.2.6. Cognito
6.4.2.2.7. DiscoverText
6.4.2.2.8. API
6.4.2.3. Open Source
6.4.2.3.1. Processing
6.4.2.3.2. GATE (General Architecture for Text Engineering)
6.4.2.3.3. R
6.4.2.3.4. Mallet: machine learning toolkit
6.5. Commentators
6.5.1. Seth Grimes
6.5.1.1. Introducing Text Analytics
6.5.1.2. “Large companies lack the agility to respond effectively and in a timely manner to the social media challenge. There is lots of room for innovation from small players.”
6.5.1.3. "Text analytics may move into databases and ETL tools"
6.5.1.4. Published: Text Analytics in 2009
6.5.1.4.1. Application
6.5.1.4.2. Data Source
6.5.1.4.3. Information To Extract
6.5.1.4.4. Satisfaction
7. When
7.1. Early Stages
7.1.1. Leverage internal skills
7.1.2. Tools
7.1.2.1. Easy to Use, Interpret and Trust
7.1.2.2. Low start-cost
7.1.3. Sweet spot
7.1.4. Business Champions
7.1.5. Quick wins
7.1.6. No formal project or budget - raise CAPEX 2013
7.2. Late Stages
7.2.1. Wall between structured and unstructured data crumbling
7.2.1.1. Integration into BI and Datamining
7.2.2. Automatic ingestion and reporting
7.2.3. Build domain expertise
7.2.4. Custom build Visualisations
8. Why
8.1. Voice of Customer / Student / Staff
8.1.1. Competitive Advantage
8.1.2. Research
8.1.3. Wellness Engine
8.1.3.1. Student Success and Risk Factors
8.1.4. Virtuous Circle
8.2. Government Funding Criteria
8.2.1. 2012 plan to introduce performance based funding as part of quality assurance arrangements
8.2.1.1. shift from voluntary to mandatory use of surveys with the results used to assess and reward academic staff performance
8.2.1.2. measures
8.2.1.2.1. student attainment of generic skills and learning outcomes
8.2.1.2.2. student retention and progression
8.2.1.2.3. student satisfaction
8.2.2. delay
8.2.2.1. did not occur due to budgetary constraints
8.2.2.2. concerns that performance based funding has discouraged diversity, student access and opportunity
8.3. Failure
8.3.1. Vodafail The Musical
8.3.1.1. ROI: Reduce Churn
8.3.2. Intuit:accounting software
8.3.2.1. website 50% increase in user self-service shrank call center support request
8.3.2.2. ROI: < 1 year
8.4. "Insanity: doing the same thing over and over again and expecting different results."
8.4.1. Albert Einsten
8.4.2. "Love: doing disappointing things and having the same feeling" - Gary Lau
9. Where
9.1. Data
9.1.1. Student Survey
9.1.1.1. First Year Experience Survey (FYES)
9.1.1.2. Course Experience Questionnaire (CEQ)
9.1.1.3. University Experience Survey (UES)
9.1.1.4. Higher Degree Research Students Annual Survey (MUSEQ-R)
9.1.1.5. Collegiate Learning Assessment (CLA)
9.1.1.5.1. may supplement CEQ
9.1.1.6. Australian Graduate Survey (AGS)
9.1.1.6.1. Best Aspects
9.1.1.6.2. Needs Improving
9.1.1.7. Beyond Graduation Survey (BGS)
9.1.1.8. CeQuery Tool: access database last updated in 2005
9.1.2. Staff Personal Development Review (PDR)
9.1.3. Research
9.1.3.1. Social Sciences
9.1.3.2. Publications
9.1.4. Content Management Systems
9.1.5. Legal Contracts
9.1.5.1. When do they expire?
9.1.5.2. Which are the high value contracts?
