
1. Demand and Supply
1.1. Demand:
1.1.1. Relationship between products price and quantity demanded.
1.1.2. Law: price and quantity demanded are inversely related.
1.1.3. Changes in quantity demanded are due to price changes.
1.1.4. Demand Determinants:
1.1.4.1. Number of Buyers
1.1.4.2. Income (Normal and Inferior)
1.1.4.3. Prices of Product (Substitute and complementary)
1.1.4.4. Consumer preference
1.1.4.5. Consumer expectations
1.2. Supply
1.2.1. Relationship between products price and quantity supplied
1.2.2. Law: price and quantity supplied are inversely related.
1.2.3. Supply Determinants
1.2.3.1. Number of Producers
1.2.3.2. Resource Prices
1.2.3.3. State of technology
1.2.3.4. Price of related products
1.2.3.5. Change in nature
1.2.3.6. Producer expectations
1.2.4. Changes in quantity supplied are due to price changes
1.3. Market Equilibrium
1.3.1. Surplus
1.3.1.1. Excess supply= price goes down
1.3.2. Shortage
1.3.2.1. Excess demand= price goes up
2. Competitive Dynamics in Government
2.1. Price Elasticity (Demand)
2.1.1. Shows how responsive consumers are to price change
2.1.2. Elastic Demand
2.1.2.1. Means % change in quantity demanded is more than % change in price
2.1.2.2. A price change causes total revenue to change in the opposite direction
2.1.3. Determinants
2.1.3.1. Portion of consumer incomes (smaller proportions=more inelastic)
2.1.3.2. Access to substitutes (More substitutes=more elastic)
2.1.3.3. Necessities Vs. Luxuries (More elastic for luxuries)
2.1.3.4. Time (More elastic with passage of time)
2.1.4. Inelastic Demand
2.1.4.1. Means % change in quantity demanded is less than % change in price
2.1.4.1.1. A price change causes total revenue to change in the same direction
2.1.5. Unit-elastic Demand
2.1.5.1. Means % change in quantity demanded is equal to % change in price
2.1.5.1.1. A price change does not affect total revenue
2.1.6. Perfect Elastic Demand
2.1.6.1. Constant price and a horizontal demand curve
2.1.7. Perfect Inelastic Demand
2.1.7.1. Constant price and a vertical demand curve
2.1.8. Calculating Elasticity
2.1.8.1. ed = ΔQd ÷ average Qd Δprice ÷ average price
2.2. Price Elasticity (Supply)
2.2.1. Measures the responsiveness of quantity supplied to price changes
2.2.2. Elastic Supply
2.2.2.1. Means % change in quantity supplied is more than % change in price
2.2.3. Inelastic Supply
2.2.3.1. Means % change in quantity supplied is less than % change in price
2.2.4. Perfect Elastic Supply
2.2.4.1. Means constant price and a horizontal supply curve
2.2.5. Perfect Inelastic Supply
2.2.5.1. Means constant quantity supplied and a vertical supply curve
2.2.6. Time
2.2.6.1. Price elasticity changes over production periods
2.2.6.1.1. Supply is perfectly inelastic in immediate run
2.2.6.1.2. Supply is either elastic or inelastic in the short run
2.2.6.1.3. Supply is perfectly elastic for a constant cost industry and very elastic for an increasing cost industry in the long run
2.2.7. Calculating Elasticity
2.2.7.1. es = ΔQs ÷ average Qs Δprice ÷ average price
2.3. Price Controls
2.3.1. A price floor is a minimum price set above the equilibrium price (results in surplus)
2.3.1.1. Price supports for agricultural goods are an example of a price floor
2.3.2. A price ceiling is a maximum price set below the equilibrium price (results in shortage)
2.3.2.1. Rent controls are an example of a price ceiling
3. Economic Problem
3.1. Economic Choice
3.1.1. Assume economic decision makers minimize their own utility
3.1.2. Opportunity Cost
3.1.2.1. Utility of the best forgone alternative (what is given up)
3.2. Definition supporting problem:
3.2.1. Economics is the study of how to distribute scarce resources against competing ends.
3.2.1.1. Microeconomics
3.2.1.1.1. Individual consumers and businesses
3.2.1.2. Macroeconomics
3.2.1.2.1. National view of an economy
3.2.2. Humans wants are UNLIMITED, but their economic resources are LIMITED. (Humans want more then they need)
3.3. Production Choice
3.3.1. Possibilities Model
3.3.1.1. Three Assumptions:
3.3.1.1.1. Economy only makes two products
3.3.1.1.2. Resources and technology are fixed (constant)
3.3.1.1.3. All resources are employed to their fullest capacity
3.3.1.2. Possibility Curve:
3.3.1.2.1. Range of possible output for economy and highlights the scarcity
3.4. Three Questions:
3.4.1. What to produce?
3.4.2. How to produce?
3.4.3. For whom?
3.5. Economic Model
3.5.1. Shows how dependent variables affect independent variables
3.5.2. Includes inverse and direct relationships
3.5.3. Positive Statements "what is"
3.5.4. Normative Statements "what should be"
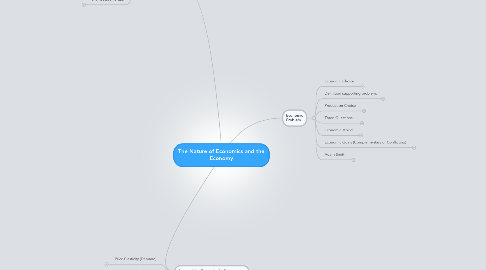
3.6. Economic Goals (Complementary or Conflicting)
3.6.1. Economic efficiency
3.6.2. Income equity
3.6.3. Price stability
3.6.4. Full employment
3.6.5. Viable balance of payments
3.6.6. Economic growth
3.6.7. Environmental sustainability
3.7. Adam Smith
3.7.1. Founder of modern economics
3.7.2. Argued government should not intervene with economic activity