
1. Perfect Competition
1.1. Conditions
1.1.1. Many buyers ad sellers
1.1.2. No barriers to entry or exit
1.1.3. Identical products
1.1.4. Perfect information
1.1.5. No externalities
1.1.6. No economies of scale
1.2. Short run
1.2.1. Supernormal profits exist
1.2.1.1. Signal for entry into market
1.2.2. Short run losses exist
1.2.2.1. Signal for exit from market
1.3. Long run
1.3.1. Supernormal profits are always eroded
1.4. Shutdown condition
1.4.1. Short run: P<AVC
1.4.2. Long run: P<AC
1.5. Benefits
1.5.1. Lower prices
1.5.2. Low barriers to entry
1.5.3. Greater entrepreneurial activity
1.5.4. Economic efficiency
2. Efficiency
2.1. Consumer surplus
2.2. Producer surplus
2.3. Static: occurs at a given moment in time
2.3.1. Allocative: P=MC
2.3.2. Productive: lowest point on AC curve
2.3.3. X efficiency: firms not on AC curve (monopoly)
2.4. Dynamic
2.4.1. Product innovation - creates new markets
2.4.2. Process innovation: changes production process
2.4.2.1. Can lead to lower costs
2.5. Perfect competition
2.5.1. Allocative efficiency
2.5.2. Productive efficiency
2.5.3. No dynamic efficiency
2.6. Imperfect competition
2.6.1. X inefficiency?
2.6.2. Product innovation
2.6.3. Process innovation
3. Concentrated markets
3.1. Concentration ratio
3.2. Motives for firms to expand
3.2.1. Market power
3.2.2. Objectives of managers
3.2.3. Profit
3.2.4. Economies of scale
3.2.5. Risk diversification
3.3. Internal growth
3.3.1. Re-invest profit
3.3.2. Increase fixed and variable factors
3.4. External growth
3.4.1. Horizontal intergration
3.4.1.1. Merger of 2 companies in the same industry at the same stage of production
3.4.2. Vertical integration
3.4.2.1. Acquisition of business in the same industry but at a different stage of production
3.4.3. Lateral merger
3.4.3.1. Merger between companies that are related but not identical
3.4.4. Conglomerate merger
3.4.4.1. Merger between firms in unrelated business
3.5. Reasons for outsourcing
3.5.1. Technological change
3.5.2. Increased competition
3.5.3. Pressure from financial markets to improve profitability
4. Oligopoly
4.1. 5-firm concentration ratio > 60%
4.1.1. Highly concentrated market
4.1.2. Few producers
4.1.3. High degree of market control
4.2. Common market features
4.2.1. Interdependance and uncertainty
4.2.2. Barriers to entry
4.2.3. Product branding
4.2.4. Non-price competition
4.3. Kinked demand curve
4.3.1. Firms aim to protect their market share
4.3.2. Rivals unlikely to match price increase but may match fall
4.3.3. Assumes price rigidity and competition based on non price factors
4.4. Key factors of non price competition
4.4.1. Better quality of service
4.4.2. Longer opening hours
4.4.3. Discounts on product upgrades
4.4.4. Contractual relationships with suppliers
4.4.5. Increased range of services
4.4.6. Advertising and loyalty cards
4.5. Collusion
4.5.1. Tacit collusion
4.5.1.1. Dominant firm sets price
4.5.1.2. Other firms follow this pricing strategy
4.5.2. Explicit collusion
4.5.2.1. Price fixing cartels
4.5.2.2. Illegal but based on desire for joint profit maximisation
4.5.2.3. Necessary conditions
4.5.2.3.1. Small number of firms in market
4.5.2.3.2. Relatively steady market demand conditions
4.5.2.3.3. Demand is fairly price elastic
4.5.2.3.4. Each firm's output can be easily monitored
4.5.3. Benefits
4.5.3.1. Joint research and development projects
4.5.3.2. Adoption of common standards
4.5.3.3. Shared use of common facilities and beneficial exchange of information
4.6. Game theory
4.6.1. Theory based around firms trying to predict competitors' strategies
4.6.2. eg. The prisoner's dilemma
5. Market Structure and Technology
5.1. Summary of market structure: most important features
5.1.1. Number of firms
5.1.2. Market share of the largest firms
5.1.3. Nature of costs
5.1.4. Vertical integration of industry
5.1.5. Extent of product differentiation
5.1.6. Structure of buyers in the industry
5.1.7. Turnover of customers
5.2. Innovation
5.2.1. Oligopolistic markets are usually best for dynamic efficiency
5.2.2. Government see it as being very important because of economic gains:
5.2.2.1. Increased competitiveness of UK prducers
5.2.2.2. Helps to develop and maintain comparative advantage
5.2.2.3. Higher productivity keeps wages low
5.2.2.4. Shifts LRAS curve outwards
5.2.2.5. Creates new jobs
5.2.2.6. Positive externalities
5.3. Pricing power
5.3.1. Perfect competition
5.3.1.1. Price takers
5.3.1.2. Long run normal profits
5.3.1.3. Homogenous products = perfectly elastic demand curve
5.3.2. Monopoly
5.3.2.1. Supernomral profits possible in long and short run
5.3.2.2. Barriers to entry protect market position
5.3.2.3. Price discrimination can be used
5.3.3. Oligopoly
5.3.3.1. Each firm has some market power
5.3.3.2. Interdepedent pricing strategies
5.3.4. Price and cross elasticity of demand
5.3.4.1. Inelastic demand allows price rise leading to rise in revenue
5.3.4.2. Elastic demand dictates that price rise leads to fall in revenue
5.3.4.3. When C.E.D is low, pricing power is higher
5.3.5. Regulatory system
5.3.6. International environment
5.3.7. Economic cycle
5.4. Technology
5.4.1. Can cut the average cost of production
5.4.1.1. New technology - teething problems
5.4.2. Switch from labour to capital
5.4.2.1. Short term job losses
5.4.3. First mover advantage vs. Second mover advantage
5.4.4. Can cause prices to fall, leading to higher consumption
5.4.5. Can cause rise in quality of products
5.4.6. Drives dynamic efficiency
5.4.7. Can cause fall in barriers to entry
5.4.7.1. If patents used can create more barriers to entry
6. Costs and Revenues
6.1. Costs
6.1.1. Variable
6.1.2. Fixed
6.2. Time period
6.2.1. Short run
6.2.2. Long run
6.3. Diminishing returns to scale
6.3.1. Point where marginal product starts to fall
6.3.2. Short run/ output fixed
6.4. Economies/ diseconomies of scale
6.4.1. Internal
6.4.2. External
6.5. Minimum efficient scale (M.E.S)
6.5.1. Bottom of the LRAC curve
6.5.2. Each firm has lowest feasible cost per unit
6.6. Revenue
6.6.1. Total
6.6.2. Marginal
6.6.3. Maximised where P.E.D = 1
7. Profit maximisation
7.1. Profits
7.1.1. Supernormal
7.1.2. Normal
7.2. Marginal cost = Marginal Revenue
7.3. Role of profit
7.3.1. Allocation of factors of production
7.3.2. Signal for market entry
7.3.3. Promotes innovation
7.3.4. Investment
7.3.5. Risk bearing reward
7.3.6. Economic performance indicator
7.4. Alternative goals
7.4.1. Revenue maximisation
7.4.2. Managerial status
7.4.3. Market share
7.5. Principal-agent problem
7.6. Behavioural theories
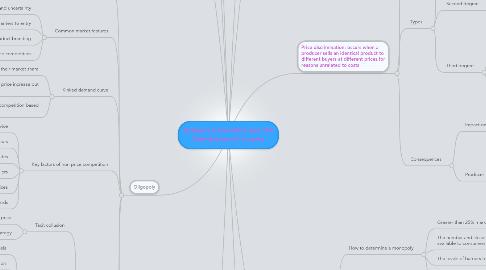
8. Price discrimination: occurs when a producer sells an identical product to different buyers at different prices for reasons unrelated to costs
8.1. Conditions necessary
8.1.1. Differences in price elasticity of demand
8.1.2. Barriers to prevent "market seepage" - no re-selling
8.2. Types
8.2.1. First degree
8.2.1.1. Charging each individual consumer the maximum they are prepared to pay
8.2.1.2. Consumer surplus is eroded
8.2.1.3. Consumer surplus becomes producer surplus
8.2.2. Second degree
8.2.2.1. Selling batches of a product at lower prices than previous batches
8.2.2.2. Method of gaining more market share
8.2.3. Third degree
8.2.3.1. Most common - charging different prices for the same product in different segments of the market
8.2.3.2. Profit maximisation technique
8.2.3.3. Methods of market separation
8.2.3.3.1. Time
8.2.3.3.2. Geography
8.2.3.3.3. Status (age etc.)
8.3. Consequences
8.3.1. Impact on consumer welfare
8.3.1.1. In most cases consumer welfare redued
8.3.1.2. Consumers can be priced into market
8.3.1.2.1. This can have positive externalities
8.3.2. Producer surplus and the use of profit
8.3.2.1. Consumer surplus transformed into supernormal profit
8.3.2.2. Supernormal profit may be re-invested to improve dynamic efficiency
8.3.2.3. Price discrimination could also be used to harm competition in the form of predatory pricing
9. Monopoly
9.1. How to determine a monopoly
9.1.1. Greater than 25% market share?
9.1.2. The number and closeness of substitutes available to consumers
9.1.3. The levels of barriers to entry
9.1.4. The degree of product differentiation
9.2. Barriers to entry
9.2.1. High fixed costs
9.2.2. Economies of scae
9.2.3. Brand loyalty
9.2.4. Legal barriers
9.2.5. Control over factors of production
9.2.6. Control over retail outlets
9.2.7. Predatory pricing
9.3. Strategic barriers to entry
9.3.1. Hostile takeovers
9.3.2. Product differentiation
9.3.3. Capacity expansion
9.3.4. Predatory pricing
9.4. Costs
9.4.1. Abnormal supernormal profits earned at the expense of efficiency and social welfare
9.4.2. Market failure due to loss of allocative efficiency and under-consumption of good
9.4.3. Productive and X inefficiency are likely to exist
9.5. Benefits
9.5.1. Economies of scale lead to lower prices
9.5.2. Potential to reach M.E.S with natural monopoly
9.5.3. Dynamic efficiency achieved due to re-investment of supernormal profits
9.5.4. Scope to be internationally competitive
10. Contestable Markets
10.1. Challenges the theory that the conduct and behaviour of firms are determined by the number of firms in the industry
10.2. States that it is the level of barriers to entry to a market that determines the conduct and behaviour of its firms
10.3. Occur when there are no barriers to entry and exit and when firms have access to same technology - same cost curves
10.4. In contestable markets firms produce at minimum cost and there is no supernormal profit
10.5. Threat of hit and run entry that drives competition
10.6. Evaluation
10.6.1. No market is perfectly contestable
10.6.2. Does threat of hit-and-run entry change behaviour of firms
10.6.3. Competition policy
10.6.4. European single market
10.6.5. Technological change