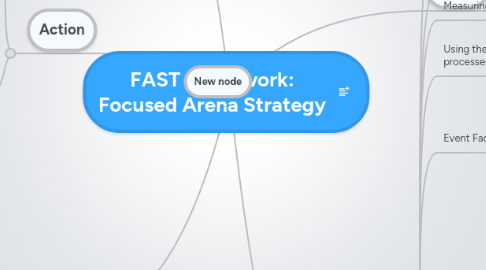
1. Focus
1.1. Pareto
1.2. Critical Path Method
1.3. Ease-Importance Chart
1.3.1. Oyster
1.3.2. Pearl
1.3.3. Quick Wins
1.3.4. White Elephant
2. Action
2.1. Project Management
2.1.1. RPG model
2.1.1.1. Resources
2.1.1.2. Process
2.1.1.3. Gap
2.2. Theory of Constraints
2.2.1. Stages
2.2.1.1. Define system goal
2.2.1.2. identify system constraints
2.2.1.2.1. Resource constraint
2.2.1.2.2. Market constraint
2.2.1.2.3. Dummy constraint
2.2.1.2.4. Policy failure constraint
2.2.1.3. exploit constraint
2.2.1.4. subordinate system to constraint
2.2.1.5. break the constraint
2.2.1.6. Avoid Inertia
2.2.1.7. back to stage 2
3. Vision
3.1. Tell the executives where we want to be in 5 years
3.2. Leadership: specific
3.3. Timeliness: needs to be updated
3.4. Selectivity: doesn't apply to EVERYTHING
3.5. Mega Trends
3.5.1. Political
3.5.2. Economical
3.5.2.1. Kondratieff Waves
3.5.3. Social
3.5.4. Technological
3.5.4.1. Schumpeter's Waves
4. New node
5. Arena
5.1. Opportunities
5.1.1. Ansoff
5.1.1.1. Old Market, old product
5.1.1.2. Old Market, New Product
5.1.1.3. New Market. Old Product
5.1.1.4. New Market, New Product
5.1.2. Real Options (Innovation Funnel)
5.1.3. Forecast
5.1.3.1. Real Data
5.1.3.2. X/Y Chart
5.1.3.3. Curve fitting
5.1.3.3.1. types of curves
5.1.3.3.2. Phases in product life
5.1.3.4. Extrapolation
5.1.3.5. Improvement
5.2. Threats
5.2.1. Probability vs Severeness
5.2.2. Risk Appetite Line
5.2.3. Shield: lower probability
5.2.4. Hedge: lower severeness
5.2.5. Capture: recognize event
5.2.6. Engage
5.3. Value Accelerators
6. Core
6.1. Strengths and Weaknesses
6.1.1. Good list: Actionable in terms of remedy and leverage
6.1.2. Bad list: Vague, lists symptoms and concentrates on external factors
6.2. The Traffic Light technique
6.3. Measuring Performance and Setting Benchmarks
6.3.1. Benchmarks for Evaluation of processes
6.3.1.1. Past performance
6.3.1.2. Peer Business Units
6.3.1.3. Competitor Performance
6.4. Using the Value Chain to map significant processes
6.4.1. Primary Functions and Secondary Functions
6.4.2. Value drivers: Different in each industry
6.4.2.1. Intellectual Property
6.4.2.2. Delivery and Logistics
6.4.2.3. Raw Materials and Inventory
6.4.2.4. Personnel and Customer Support
6.4.2.5. IT and Telecommunications system
6.4.2.6. Manufacturing Plant and
6.5. Event Factor Analysis for S&W identification
6.5.1. Three Wins
6.5.2. Three Losses
6.5.3. Three Pending event not yet determined
6.6. Root Cause Analysis
6.6.1. CRT - Current Reality Tree
6.6.1.1. ONE major un-desired effect
6.6.1.2. 8-12 un-desired effects
6.6.1.3. 3-5 root problems
6.6.2. CCT - Core Competence Tree
6.6.2.1. ONE major desired effect (usually value creation or profit)
6.6.2.2. 8-12 desired effects
6.6.2.3. 3-5 core competencies
6.7. Continuous Improvement and Resource Allocation
6.7.1. Toyota's Kayzen
6.8. P4A - continuous value creation
6.8.1. Machine Metaphore
6.8.1.1. Scientific Management
6.8.1.2. Division of Labor
6.8.1.3. Static Processes
6.8.2. Organic Metaphore
6.8.3. Initials:
6.8.3.1. Process
6.8.3.2. Performance
6.8.3.2.1. yield
6.8.3.2.2. overhead expenses
6.8.3.2.3. response time
6.8.3.2.4. meeting time objectives
6.8.3.2.5. Inventory
6.8.3.2.6. Quality
6.8.3.2.7. Stages:
6.8.3.3. Pareto
6.8.3.4. Problems: Ishikawa
6.8.3.5. Action Items
6.8.3.5.1. Swimming Lanes

