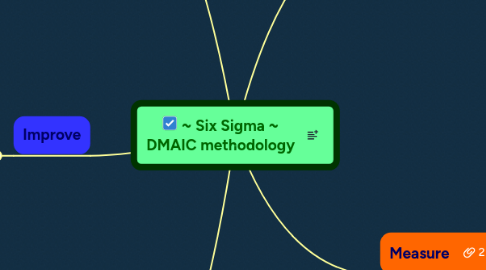
1. Analyse
1.1. Identifying potencial cause
1.1.1. Brainstorm
1.1.2. 5 whys
1.1.3. Tree diagram
1.1.4. FMEA
1.1.5. Fishbone/Ishikawa
1.2. Verifying causes
1.2.1. Hypothesis testing
1.2.2. Correlations and regressions
2. Improve
2.1. Generating and selecting solutions
2.1.1. FMEA
2.1.2. Priority matrix / pugh
2.1.3. Ideabox, analogies
2.1.4. Brainstorming
2.2. Implementing solutions
2.2.1. Gantt diagram
2.2.2. Change plot
2.2.3. Power/interest matrix
2.2.4. Involvement matrix
2.2.5. Action plan, PDCA
2.3. Evaluating results
2.3.1. Pareto diagrams
2.3.2. Time-frecuency diagrams
3. Control
3.1. Standarization
3.1.1. Process
3.1.2. Training
3.1.3. Documentation
3.2. Process monitoring and control
3.2.1. Process management
3.2.2. Audit
3.2.3. Control charts
3.3. Communication:storyboard
4. Define
4.1. Project Charter
4.2. VoC
4.2.1. Affinity diagram
4.2.2. CTQ (Cost to Quality)
4.2.3. Kano
4.2.4. Pareto diagram
4.3. SIPOC
5. Measure
5.1. Determinating process sigma
5.1.1. Process capability
5.1.2. Specification limits
5.2. Process analysis
5.2.1. Deployment flowcharts
5.2.2. Value add flow charts
5.2.3. Activity flowcharts
5.3. Pattern not related to time
5.3.1. Descriptive statistics (frecuency)
5.3.2. Pareto diagram
5.3.3. Stratified frecuency plots
5.4. Pattern related to time
5.4.1. Common and special cause variation
5.4.2. Run charts or Time plots
5.4.3. Time/frecuency diagrams
