
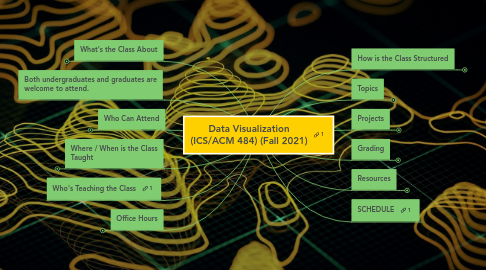
1. What's the Class About
1.1. The objective is to introduce students about the broad field of data visualization, and relevant software tools, so that they are able to obtain basic mastery of the skills needed to: 1. turn raw data into effective visualizations of the data, 2. evaluate the efficacy of visualizations.
2. Both undergraduates and graduates are welcome to attend.
3. Who Can Attend
3.1. Students from disciplines other than computer science are very welcome to attend and are encouraged to bring their data.
3.2. Having some programming experience helps but is not absolutely necessary.
3.3. Email: leighj@hawaii.edu to get a class override.
4. Where / When is the Class Taught
4.1. Class will be taught in the CyberCANOE in the Cyber Infrastructure Lab- Keller 103
4.2. Class is held on Wednesdays from 3-5:30p
5. Who's Teaching the Class
6. Office Hours
6.1. Tuesdays : noon-2pm - Please email Jason in advance.
6.2. Join our Cloud HD Video Meeting
7. How is the Class Structured
7.1. First half of each class involves Jason lecturing on a visualization topic.
7.2. Second half involves students presenting about
7.2.1. A data set they are interested in visualizing
7.2.2. A visualization framework they would like to use
7.2.3. Progress update on projects 1 and 3.
7.3. Teams will be multi-disciplinary- ideally including computer scientist, domain scientist, artist etc.
8. Topics
8.1. Overview of the Field of Data Visualization
8.2. History of Data Visualization
8.3. Tools used for the class
8.4. Process of Data Visualization
8.5. Best practices in Information Visualization
8.6. Geospatial Visualization
8.7. Privacy Issues in Data Visualization
8.8. Uncertainty in Visualization
8.9. Social Network Visualization
8.10. Working with Data
8.11. Visual Analytics
8.12. Scientific and Medical Visualization
8.13. Dynamic Data Visualization
8.14. Visualization Hardware
9. Projects
9.1. Project 0 (10 points)
9.1.1. Each week 3 students will introduce a visualization found on the web for the lab to critique.
9.1.2. Critique will last no more than 5 minutes each.
9.1.3. Critique will explain:
9.1.3.1. Who developed the visualization
9.1.3.1.1. What organization
9.1.3.1.2. Where is the organization
9.1.3.2. What data is being visualized
9.1.3.3. Where was data obtained
9.1.3.4. How was the visualization created
9.1.3.4.1. What kind of visual representations
9.1.3.4.2. What technical infrastructure (Leaflet, Plotly, etc)
9.1.3.5. Why was the visual representation good / bad
9.2. Project 1 (20 points)
9.2.1. Project to produce a visualization using Plot.ly
9.2.2. Data will be chosen by Jason.
9.3. Project 2 (20 points)
9.3.1. Select a Visualization framework and give a presentation in class
9.3.1.1. Three.JS
9.3.1.2. Vega
9.3.1.3. VegaLite
9.3.1.4. D3
9.3.1.5. Google Charts
9.3.1.6. Chart.JS
9.3.1.7. Springy
9.3.1.8. Processing
9.3.1.9. Scene.JS
9.3.1.10. WebGL
9.3.1.11. Shiny
9.3.1.12. Wrld.js
9.3.1.13. Bokeh
9.3.1.14. Mapbox
9.3.2. or select a paper from the last 5 years of IEEE Visualization conference or related visualization conference to present
9.3.2.1. E.g. Text Visualization
9.4. Project 3 (50 points)
9.4.1. Group Project to produce a visualization poster from scratch using your own data set and chosen API.
9.4.2. Take a visualization technique and attempt to implement it from scratch.
10. Grading
10.1. There are no exams.
10.2. This class is about what you can DO, not what you can memorize so grades will be determined by the work you put into the Projects.
11. Resources
11.1. Tools
11.1.1. 50K Foot View of the Data Visualization Process
11.1.2. Plot.ly
11.1.2.1. Plotly Main site
11.1.2.2. Plotly Javascript site
11.1.2.3. Dash
11.1.2.4. Chart Studio
11.1.3. Leaflet
11.1.4. The Visualization Toolkit
11.1.4.1. VTK.js
11.1.4.2. VTK book
11.1.4.3. VTK User Guide
11.1.4.4. ParaView
11.1.5. Color Brewer
11.2. Data
11.2.1. Kaggle
11.2.2. Hawaii Data
11.2.3. COVID