Graphic Organizers
por Erika Raygoza


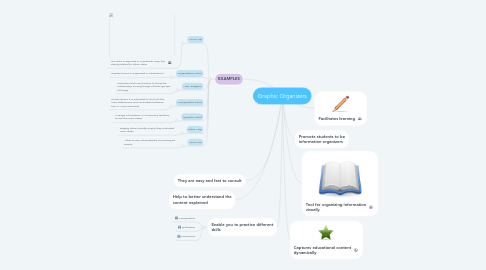
1. They are easy and fast to consult
2. Help to better understand the content explained
3. Enable you to practice different skills
3.1. Comparative
3.2. Synthesize
3.3. Summarize
4. EXAMPLES
4.1. Mind Map
4.1.1. The data is exposed in a synthetic way, but clearly related to other ideas
4.2. Organization Chart
4.2.1. Display how it is organized in hierarchical
4.3. Venn Diagram
4.3.1. Ilustration that used circles to show the relationship among things of finite groups of things
4.4. Comparative Chart
4.4.1. Charts where it is intended to find out the main differences and similarities between two or more elements
4.5. Synoptic Chart
4.5.1. Arrange information in a hierarchy facilities to see the main ideas
4.6. Ideas Map
4.6.1. Display ideas visually simply they indicated main ideas
4.7. Time Line
4.7.1. Allow to see schematically chronological events
