PERT Chart

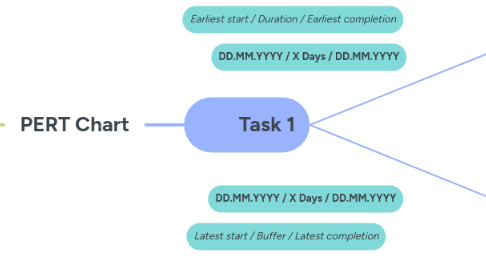
PERT stands for Program Evaluation Review Technique. A PERT diagram helps you to visualize and plan a complex project by calculating how long individual project tasks will take to complete. This allows you to better estimate the expected overall duration and costs of the project.
Get Started. It's Free
or sign up with your email address
PERT Chart by Mind Map: PERT Chart

1. Start Date: DD.MM.YYY

2. Earliest start / Duration / Earliest completion

3. Earliest start / Duration / Earliest completion

4. DD.MM.YYYY / X Days / DD.MM.YYYY

5. DD.MM.YYYY / X Days / DD.MM.YYYY

6. Task 4

7. Task 2

8. Earliest start / Duration / Earliest completion

9. Earliest start / Duration / Earliest completion

10. DD.MM.YYYY / X Days / DD.MM.YYYY

11. DD.MM.YYYY / X Days / DD.MM.YYYY

12. DD.MM.YYYY / X Days / DD.MM.YYYY

13. DD.MM.YYYY / X Days / DD.MM.YYYY

14. Task 5

14.1. End Date: DD.MM.YYYY

15. Latest start / Buffer / Latest completion

16. Latest start / Buffer / Latest completion

17. DD.MM.YYYY / X Days / DD.MM.YYYY

18. DD.MM.YYYY / X Days / DD.MM.YYYY

19. Earliest start / Duration / Earliest completion

20. Latest start / Buffer / Latest completion

21. Latest start / Buffer / Latest completion

22. DD.MM.YYYY / X Days / DD.MM.YYYY

23. Task 1

24. Task 3

25. DD.MM.YYYY / X Days / DD.MM.YYYY

26. Latest start / Buffer / Latest completion