

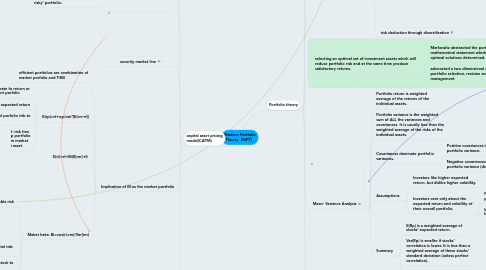
1. capital asset pricing model(CAPM)
1.1. Assumption
1.1.1. Investors are rational, risk-averse, utility maximizers.
1.1.2. They perceive utility in terms of return.
1.1.3. They measure risk by standard deviation of returns.
1.1.4. They have a single-period investment horizon.
1.1.5. They all have the same expectations about what the uncertain future holds.
1.1.6. There are no taxes and no transaction costs.
1.1.7. Investors can both borrow and lend at the risk-free rate of return.
1.2. Captal Market Line
1.2.1. With the introduction of risk free investments held in combination with the market portfolio (M) it is possible to achieve returns outside of the opportunity set - and enhance the return for the given level of risk.
1.2.2. The market portfolio is a fully diversified portfolio of all assets available in the market.
1.2.3. The market portfolio is an ‘efficient risky’ portfolio.
1.3. security market line
1.4. Implication of M as the market portfolio
1.4.1. efficient portfolios are combination of market porfolio and T-Bill
1.4.2. E(rp)=rf+op/om*[E(rm-rf)]
1.4.2.1. This yields the required rate fo return or cost of capital for efficient porfolio
1.4.2.2. Trade-off between risk and expected return
1.4.2.3. Multiplier is the raito of porfolio risk to market risk
1.4.2.4. f :risk free p portfolio m market i asset
1.4.3. E(ri)=rf+Bi(E[rm]-rf)
1.4.4. Maket beta: Bi=cov(ri,rm)/Var[rm]
1.4.4.1. beta measure diversifiable risk
1.4.4.1.1. 0 there is no risk and the expected return is the risk-free asset.
1.4.4.1.2. <1, then expected return is less than the market expected return (this is known as defensive asset).
1.4.4.1.3. = 1 then the asset has the same risk as the market and expected returns will be the same as the market expected return.
1.4.4.1.4. > 1 then expected return is greater than the market expected return (this is know as aggressive asset).
1.4.4.2. standard deviation measures total risk: div&non-div
1.4.4.3. beata measues sensitivity of stock to market movement
1.4.4.4. exmaple
1.4.4.4.1. Tesco0.68
1.4.4.4.2. British land 1.11
1.4.4.4.3. Barclays PLC 2.7
1.5. advantage vs dis CAPM to the analysis of property investment is limited.
1.5.1. ad
1.5.1.1. Is a theoretical and quantitative approach to determining the risk premium.
1.5.1.2. CAPM offers a rational method for pricing of risks of individual investments.
1.5.2. dis
1.5.2.1. How to calculate Beta?
1.5.2.1.1. Reliance on historic data.
1.5.2.2. Underlying assumptions do not hold true.
1.5.2.3. Beta values change with time.
1.5.2.4. Beta values slow to respond to changes.
1.5.3. limitation
1.5.3.1. Single-period analysis.
1.5.3.2. Indivisibility:
1.5.3.3. Defining the market:
1.5.3.4. Common expectations:
1.5.3.5. Valuation:
2. Portfolio theory
2.1. developed by Harry Markowitz in the early 1950s .
2.2. assumption
2.2.1. Securities markets are very competitive and efficient
2.2.2. These markets are dominated by rational, risk-averse investors who seeks to
2.2.2.1. maximize return for a given level of risk, or
2.2.2.2. minimize risk for a given return
2.3. risk
2.3.1. investor attitude
2.3.1.1. Risk averse
2.3.1.1.1. requires increasing amounts of return for additional units of risk
2.3.1.2. Risk neutral
2.3.1.2.1. indifferent
2.3.1.2.2. requires constant return for additional units of risk
2.3.1.3. Risk seeker
2.3.1.3.1. requires decreasing amounts of return for additional units of risk
2.3.2. Total Risk comprises
2.3.2.1. Diversifiable Risk
2.3.2.1.1. – referred to as Specific Risk (unique or non-systematic) - this risk can be reduced/eliminated by holding a diversified portfolio of assets.
2.3.2.2. Non-diversifiable Risk -
2.3.2.2.1. Systematic Risk (market risk, non-specific) – this cannot be diversified away – it is carried by all investments in the market. This risk will be compensated by the market.
2.3.2.3. risk deduction through diversification
2.4. selecting an optimal set of investment assets which will reduce portfolio risk and at the same time produce satisfactory returns.
2.4.1. Markowitz abstracted the portfolio problem into a mathematical statement which could be resolved, and optimal solutions determined.
2.4.2. advocated a two dimensional approach to portfolio selection, revision and management
2.4.2.1. expected return-variance of return
2.4.2.1.1. . mean-variance analysis
2.5. Mean- Variance Analysis
2.5.1. Portfolio return is weighted average of the returns of the individual assets.
2.5.2. Portfolio variance is the weighted sum of ALL the variances and covariances. It is usually less than the weighted average of the risks of the individual assets.
2.5.3. Covariances dominate portfolio variances.
2.5.3.1. Positive covariances increase portfolio variance.
2.5.3.2. Negative covariances decrease portfolio variance (diversification).
2.5.4. Assumptions
2.5.4.1. Investors like higher expected return, but dislike higher volatility.
2.5.4.2. Investors care only about the expected return and volatility of their overall portfolio.
2.5.4.2.1. Not individual stocks in the portfolio
2.5.4.2.2. Investors are generally assumed to be well-diversified.
2.5.5. Summary
2.5.5.1. E(Rp) is a weighted average of stocks’ expected return.
2.5.5.2. Var(Rp) is smaller if stocks’ correlation is lower. It is less than a weighted average of these stocks’ standard deviation (unless perfect correlation).
2.5.5.3. The portfolio’s mean/Var is non-linear.
2.6. Multi-Asset Portfolio
2.6.1. Risk indifference curves and the opportunity set
2.6.1.1. 2
2.7. Practical applications
2.7.1. Difficulty in determining the indifference curve of an investor. Morden fund management strategies are set against benchmarks and the MPT analysis has to be adjusted accordingly.
2.7.2. When applying MPT to property analysis, the quality and availability of data from which to forecast returns and estimate standard deviation and correlations for assets are limited. The difficulties of forecasting the inputs for individual properties means it is extremely unlikely that MPT could ever be used at that level of disaggregation in the property market.